Timeline view
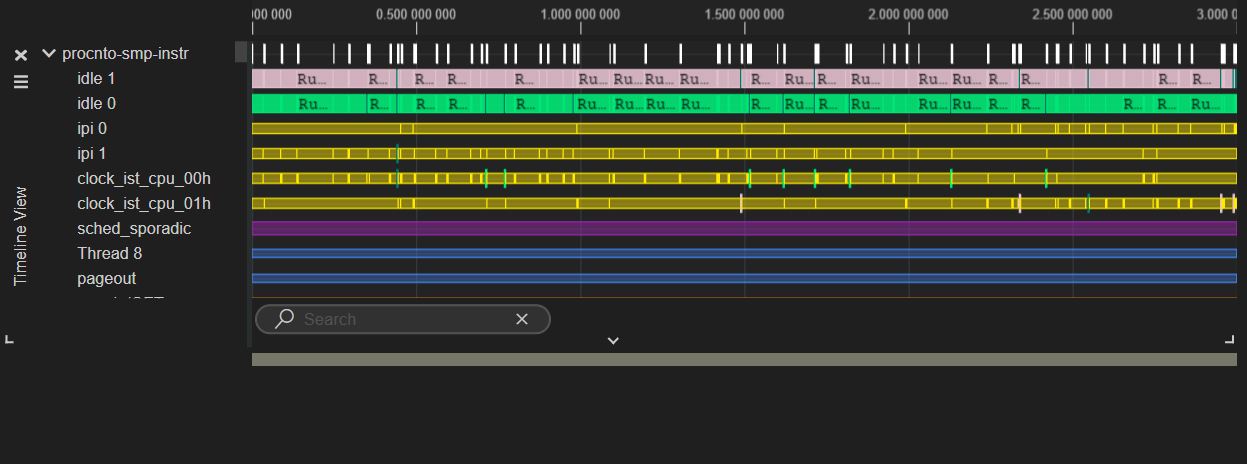
The Timeline view shows the chronology of the logged kernel events of a trace.kev file.
You can hover over the color bands to display relevant
information. You can also configure the colors and thickness settings. Go to Editing colors and thickness
for details.
Opening the view
Timeline is one of the dashboard views in the System Profiler.
To open the view:
- Click QNX SYSTEM PROFILER, then select a .kev file.
- Click DASHBOARDS > Timeline. The Timeline view is displayed:
Toolbar actions
You can take the following actions from the toolbar in the Timeline view:
| Toolbar action | Description |
|---|---|
| View execution states of threads and processes over time. | |
| Display event ticks as bars on the timeline. | |
| View the behavior of CPU cores over time. | |
| Show communication events between threads or processes (interprocess communication lines). | |
| View single event or ranged bookmarks. When bookmarks are enabled they appear in a shaded color on the timeline. | |
| Zoom in to reveal fine-grained detail on the timeline. | |
| Zoom out to obtain a higher level overview of system activity. | |
| Reset zoom. | |
| Sync the timeline with the owner and event filters in the System Profiler. | |
| Enable two-way sync between the timeline and the other System Profiler views. This aligns all views to the same time window. |
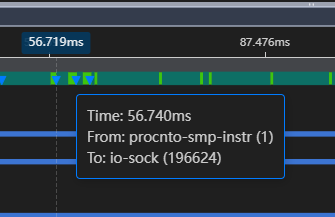
About IPC lines
Filtering traces.
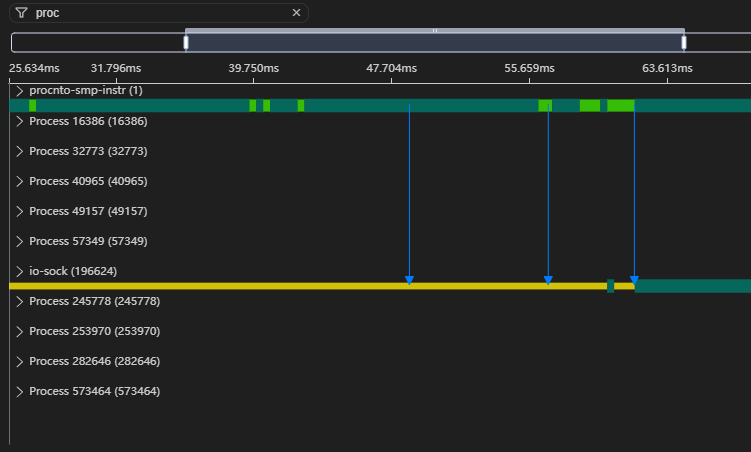
Filtering the view
You can filter the Timeline view using the Filter box.
To filter the view:
- In the Timeline view, click the Filter
 icon at the top left.
 - Enter the name of a process in the field.
The view is updated to show timeline information only for the process that you've entered.
Editing colors and thickness
You can use the TIMELINE COLORS option in the QNX menu to edit the colors and thinkness properties for the states and CPUs that display on the Timeline.
- Click TIMELINE COLORS:
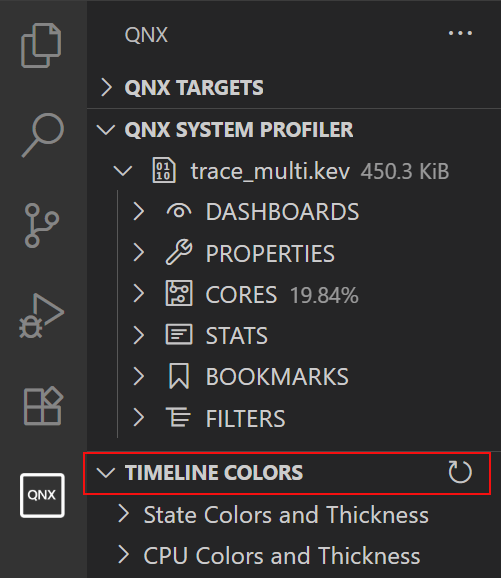
- Click State Colors and Thickness:

- To change the color, click one of the colors and adjust the color picker accordingly.
- To change the thickness, click one of the numbers and adjust it accordingly.
- Click TIMELINE COLORS.
- Click CPU Colors and Thickness:

- To change the color, click one of the colors and adjust the color picker accordingly.
- To change the thickness, click one of the numbers and adjust it accordingly.