Event Density view
QNX Toolkit1.1QNX Toolkit User's GuideDeveloperSetup
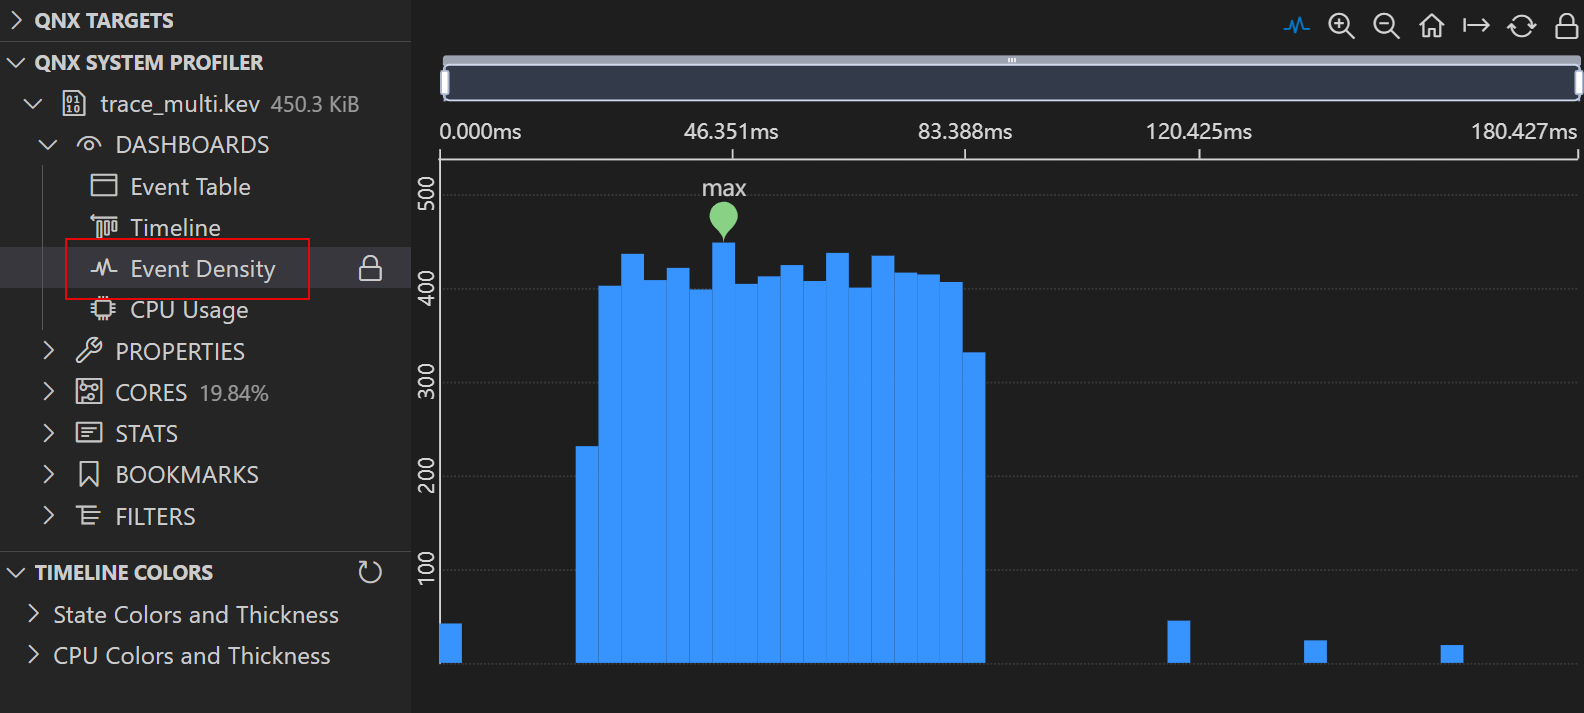
The Event Density view shows the event count over time for a trace.
Opening the view
Event Density is one of the dashboard views in the System Profiler.
To open the view:
- Click QNX SYSTEM PROFILER, then select a .kev file.
- Click DASHBOARDS > Event Density. A graph of events over time is displayed:
Toolbar actions
You can take the following actions from the toolbar in the Event Density view:
| Toolbar actions | Description |
|---|---|
| Auto-adjusts the vertical scale (height) so that all content fits neatly in the view. Turn off to view 100% of the graph. | |
| Zoom in to reveal fine-grained detail on the Event Density. | |
| Zoom out to obtain a higher level overview of system activity. | |
| Reset zoom. | |
| Export the event density values to a CSV file with headers. | |
| Sync the event density data with the owner and event filters in the System Profiler. | |
| Enable two-way sync between the event density data and the other System Profiler views. This aligns all views to the same time window. |
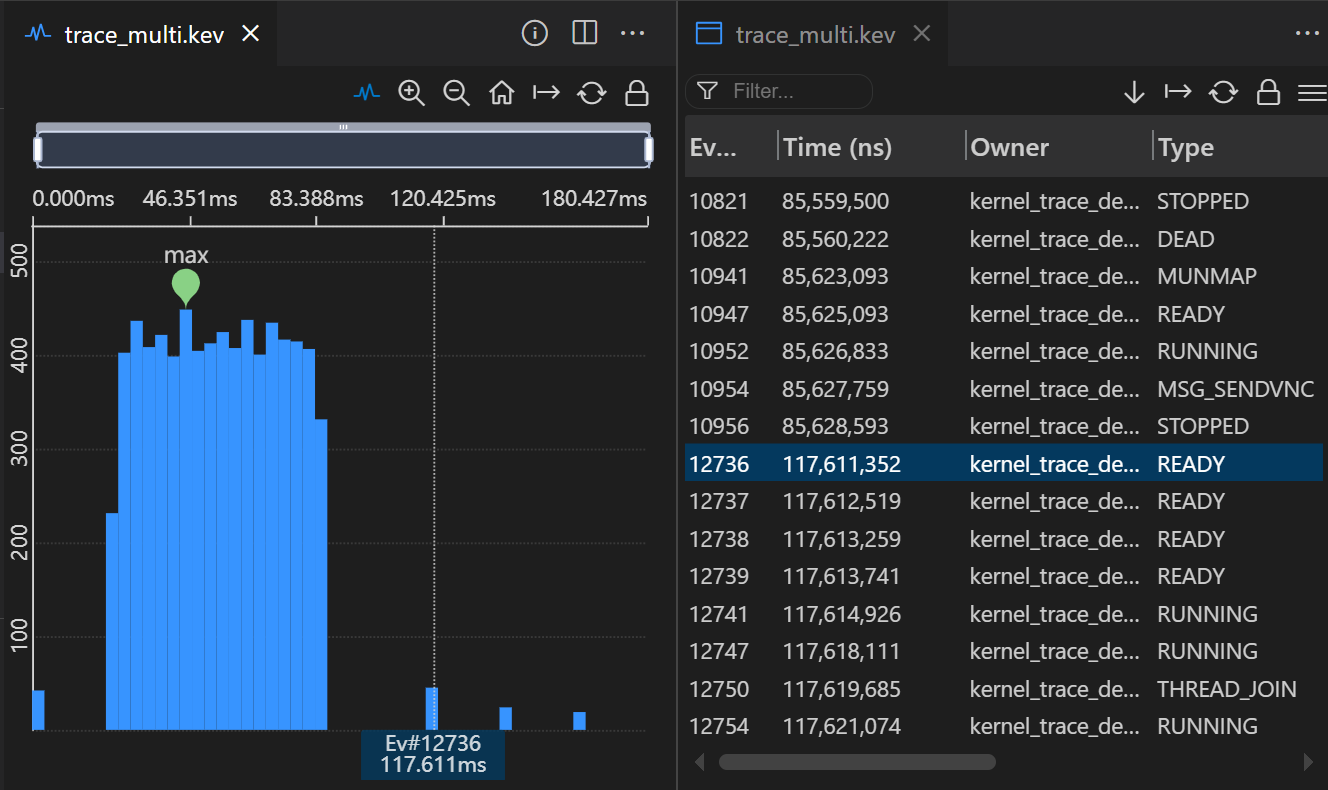
Event Table synchronization
When you click on a specific event in the Event Density graph,
the Event Table view jumps to the selected event:
Page updated: