Filtering traces
Using the filters, you can globally restrict which owners and events are displayed in the System Profiler dashboard views.
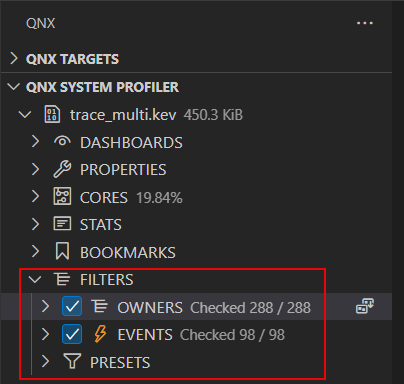
- OWNERS — A filter that lets you check boxes to choose the owners to include in the displayed results.
- EVENTS — A filter that lets you select specific event classes or types to include in the results. You must expand class entries to see individual types.
- PRESETS — A set of commands that can enable or disable certain elements on other filters.
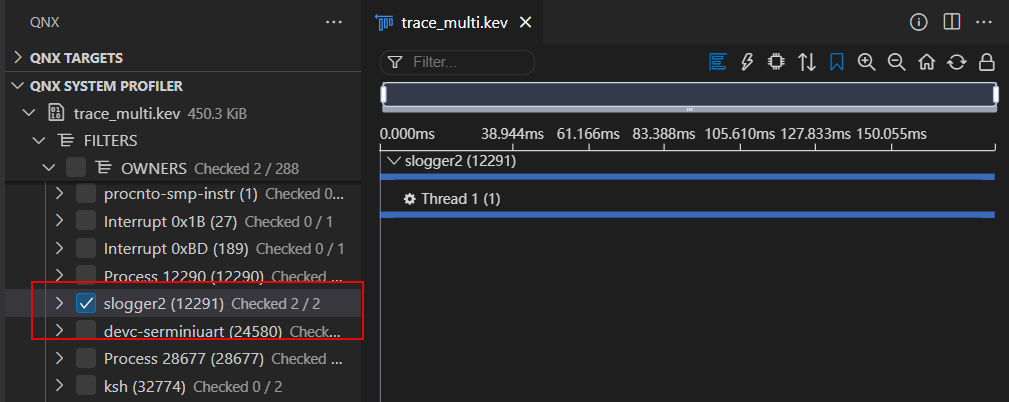
Owners
You can use OWNERS to filter for processes and threads that you are interested in.
To filter the owners:
- Click QNX SYSTEM PROFILER, then select a .kev file.
- Click FILTERS > OWNERS.
- Check the specific owners to include.
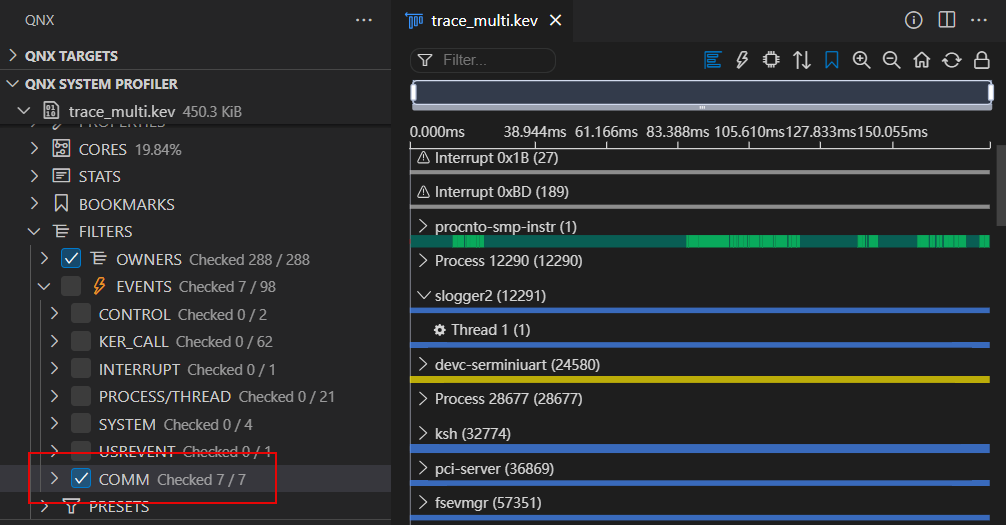
Events
You can use EVENTS to filter Event Table information.
To filter the events:
- Click QNX SYSTEM PROFILER, then select a .kev file.
- Click FILTERS > EVENTS.
- Check the specific events to include.
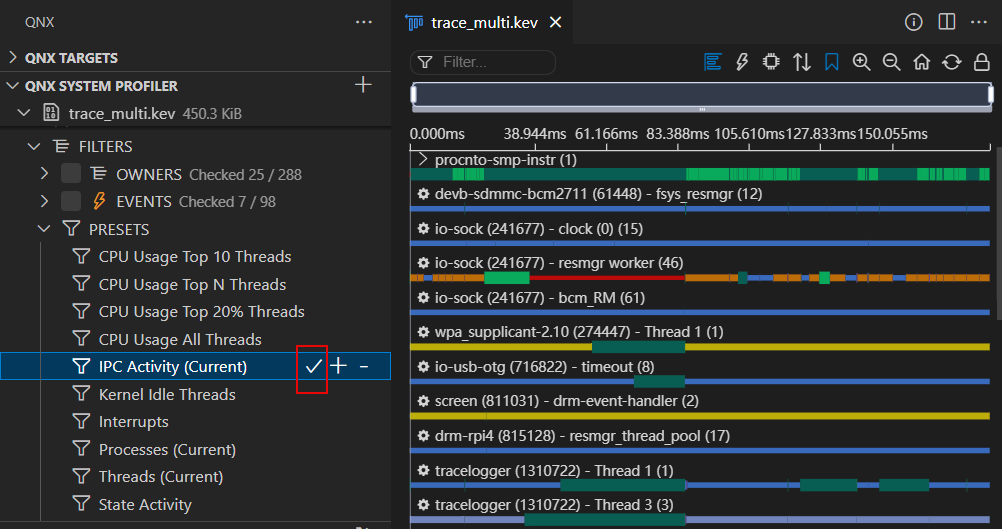
Presets
You can use PRESETS to apply a pre-selected set of filters that apply to specific elements. For example, you can select a preset that shows you only filters for CPU usage elements, or only information for elements involved in IPC activity.
To apply the filter presets:
- Click QNX SYSTEM PROFILER, then select a .kev file.
- Click FILTERS > PRESETS.
- Check the specific presets, then select one of the three options:
- Click the Show Only
 icon to filter some elements and hide others.
 - Click the Show More
 icon to add more filter elements to the current filter.
 - Click the Hide
 icon to hide the filter elements from view.
- Click the Show Only
The following table describes the possible preset commands you can use:
| Preset Command | Description |
|---|---|
| CPU Usage Top 10 Threads | Show the top 10 threads with the most CPU usage. |
| CPU Usage Top N Threads | Show the top number of threads with the most CPU usage. Enter a number when prompted. |
| CPU Usage Top 20% Threads | Show the threads in the top 20% of CPU usage. |
| CPU Usage All Threads | Show all threads with associated CPU usage. |
| IPC Activity (Current) | Show IPC activity for events selected in the Event Table. |
| Kernel Idle Threads | Display idle threads. |
| Interrupts | Display interrupts and interrupt handlers. |
| Processes (Current) | Show only processes that are not threads (e.g. IPI_64,
SND_PULSE_EXE). |
| Threads (Current) | Show only threads. |
| State Activity | Display elements involved in state change activity and interrupts activity. |
| Text Match (Owners) | Show only the processes and events that correspond to text-based search. Enter a string when prompted. |
Saving filtered traces
You can save a partial trace.kev file based on user filters (time range, zoom region, full selection range, as well as owner and event filters).
To save a filtered trace:
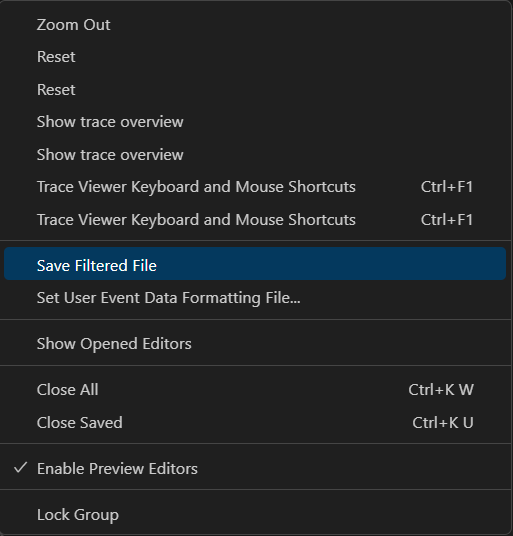
- Right-click the trace.kev file in the System Profiler.
- Click Save Filtered File:
- Select the time range: Current Zoom, Manually Enter, or Full.
- Select filters to apply: Both, Event, Owner, or None.
- Save the filtered file.You are prompted with the following notification:
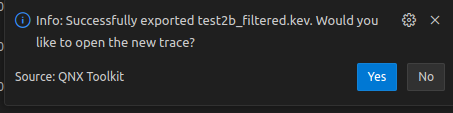
- Select Yes to open the filtered file.
| Heading | Description |
|---|---|
| Current Zoom | Use current zoom region of the trace. |
| Manually Enter | Manually enter time range. |
| Full | Entire time range of the trace. |
| Heading | Description |
|---|---|
| Both | Apply both owner and event filters. |
| Event | Apply only event filters. |
| Owner | Apply only owner filters. |
| None | Apply no filters. |
Essential events:
Essential events always display regardless of the applied filtering settings. As a result, the time range of a saved .kev file is sometimes longer than the selected time range. Furthermore, some essential events cannot be filtered out and, thus, the number of events in the new .kev file may be greater than expected.
- _NTO_TRACE_SYS_APS_NAME.
- _NTO_TRACE_SYS_APS_BUDGETS.
- _NTO_TRACE_PROCTHREAD_NAME.
- _NTO_TRACE_PROCCREATE_NAME.
- _NTO_TRACE_THRUNNING.
- _NTO_TRACE_THREADY.
- _NTO_TRACE_CONTROL class; go to
Control class:_NTO_TRACE_CONTROL
in theEvents and the Kernel
chapter of the System Analysis Toolkit User's Guide. - The procnto utility or its threads; go to the procnto utility in
the
Utilities Reference
chapter of Utilities & Libraries for more information.
For more information about events, go to Table of events
in the Current
Trace Events and Data
chapter of the System Analysis Toolkit User's
Guide.
Filter synchronization
Each dashboard View in the System Profiler can be synced or desynced from the global filters (Owners, Events, Presets). You can also sync or desync individual views with the other views (eg., desync the CPU Usage view so that zooming in/out doesn't impact what's shown in the Timeline view).
Each System Profiler view has filter synchronization capabilities. By way of example, you can follow the procedure to sync or desync the CPU Usage View.
To change the CPU Usage view synchronization behavior with the other views:
- From the CPU Usage view, click the Sync/Desync With Other Views
 icon. When the views are synced, changes
made to the zoom or filtering settings are reflected on any other synched views.
icon. When the views are synced, changes
made to the zoom or filtering settings are reflected on any other synched views.
To change the global synchronization behavior
- From the CPU Usage view, click the Sync/Desync Global
Filters
 icon. When the views
are synced, changes made to the global filters show up in the CPU
Usage view.
icon. When the views
are synced, changes made to the global filters show up in the CPU
Usage view.