Properties
QNX Toolkit1.1QNX Toolkit User's GuideDeveloperSetup
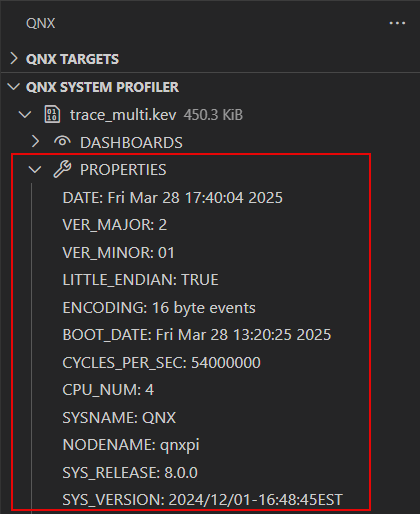
The PROPERTIES list shows you high level information regarding the .kev file under analysis.
Opening the view
You can display the trace properties by expanding PROPERTIES in the System Profiler.
To open the view:
- Click QNX SYSTEM PROFILER, then select a .kev file.
- Click PROPERTIES. The properties of the trace are displayed:
The available types are as follows:
| Key | Description |
|---|---|
| TOTAL_LOG_FILE_TIME | The total time span covered by the trace log. |
| TOTAL_NUMBER_OF_EVENTS | The count of individual events captured in the trace log. |
| DROPPED_BUFFERS | The number of event buffers that were not recorded due to buffer overflow or other reasons. |
| BUSY_TIME | The cumulative time during which the CPU was actively processing tasks. |
| IDLE_TIME | The cumulative time during which the CPU was not actively processing tasks. |
| BOOT_DATE | The system's boot date and time. |
| CPU_NUM | The number of CPUs on the system. |
| CYCLES_PER_SEC | The number of clock cycles per second for the CPU. |
| DATE | The date and time when the trace was captured. |
| ENCODING | The size of each event entry in the trace. |
| FILE_NAME | The path to the trace file. |
| LITTLE_ENDIAN | The endianness of the system; true for little endian and false for big endian. |
| MACHINE | The type of machine or architecture. |
| NODENAME | The network name of the machine. |
| NORMALIZEDN | Numerical value that indicates that the trace was normalized by IDE. |
| SYSNAME | The operating system name. |
| SYSPAGE_LEN | The length of the system page. |
| SYS_RELEASE | The release version of the operating system. |
| SYS_VERSION | The build date and time of the operating system. |
| TRACELOGGER_ARGS | Tracelogger arguments. |
| VER_MAJOR | The major version number of the trace system. |
| VER_MINOR | The minor version number of the trace system. |
Page updated: