Managing traces
QNX Toolkit1.1QNX Toolkit User's GuideDeveloperSetup
Opening a trace file starts the System Profiler and displays its dashboard views.
Opening a trace
To open a trace:
- In the filesystem of your workspace, select the .kev file to open.
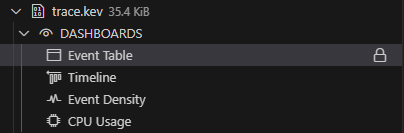
- Click the file, and the System Profiler displays the following dashboard views:
Event Table, Timeline,
Event Density, and CPU Usage:
Closing a trace
To close a trace:
- Click QNX SYSTEM PROFILER, then select the .kev file to close.
- Click the Eye Closed
 icon:
icon: 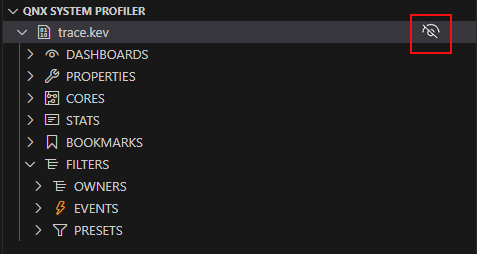
The Trace tab is closed in VS Code.
Removing traces from the System Profiler
To remove a trace:
- In the VS Code workspace, select the .kev file to remove.
- Right-click the file and select Delete from the menu:
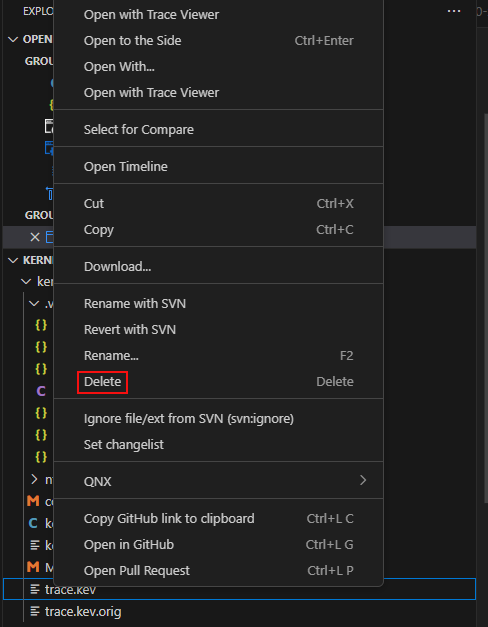
The trace is removed from the VS Code workspace and the filesystem.
Event decoding
You can insert user events into the event stream. This is useful for flagging events or bracketing groups of events to isolate them for study.
You can provide custom event data formatting for the custom user events;
you must provide an event definition file describing the data format for the custom user events. Go to System Profiler: user event formatting XML reference
for more information.
To specify the path to the file:
- Click the Extensions
 icon on the Primary Side Bar.
 - Next to QNX Toolkit, click the Manage
 icon:
icon: 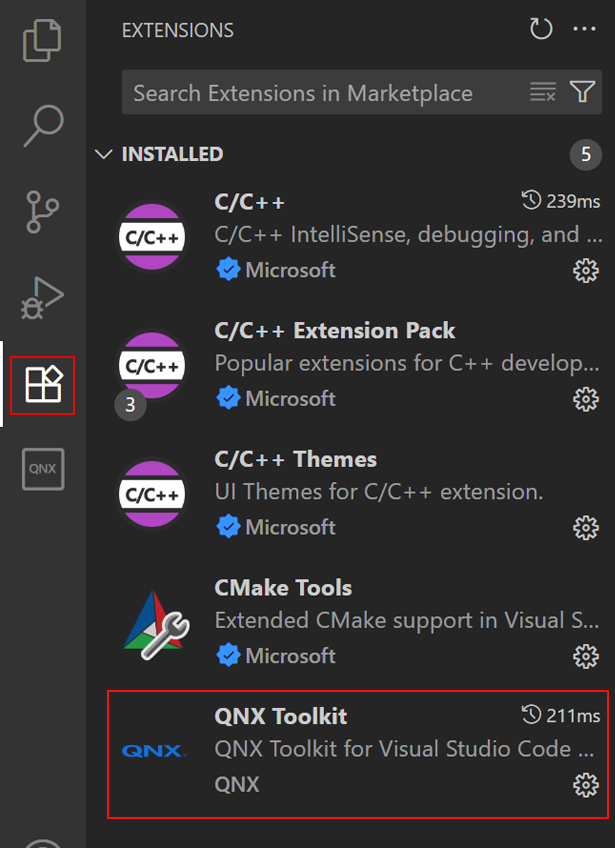
- Click Settings.The Path to user events definition file field opens:
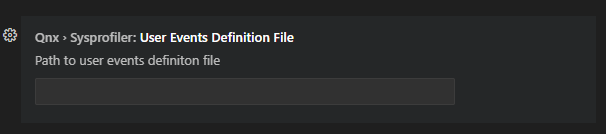
- Specify the path.
Example:
<eventformatting>
    <datakey format="%4u1x state %d seq_id">
        <event class="6" id="22"/>
        <enum name="state" value="0x0" string="INPUT_RECEIVED"/>
        <enum name="state" value="0x1" string="START_PROCESSING"/>
        <enum name="state" value="0x2" string="END_PROCESSING"/>
        <enum name="state" value="0x3" string="REQUEST_RENDER"/>
        <enum name="state" value="0x4" string="RENDER_COMPLETE"/>
    </datakey>
</eventformatting>
Page updated: