CPU Usage view
QNX Toolkit1.1QNX Toolkit User's GuideDeveloperSetup
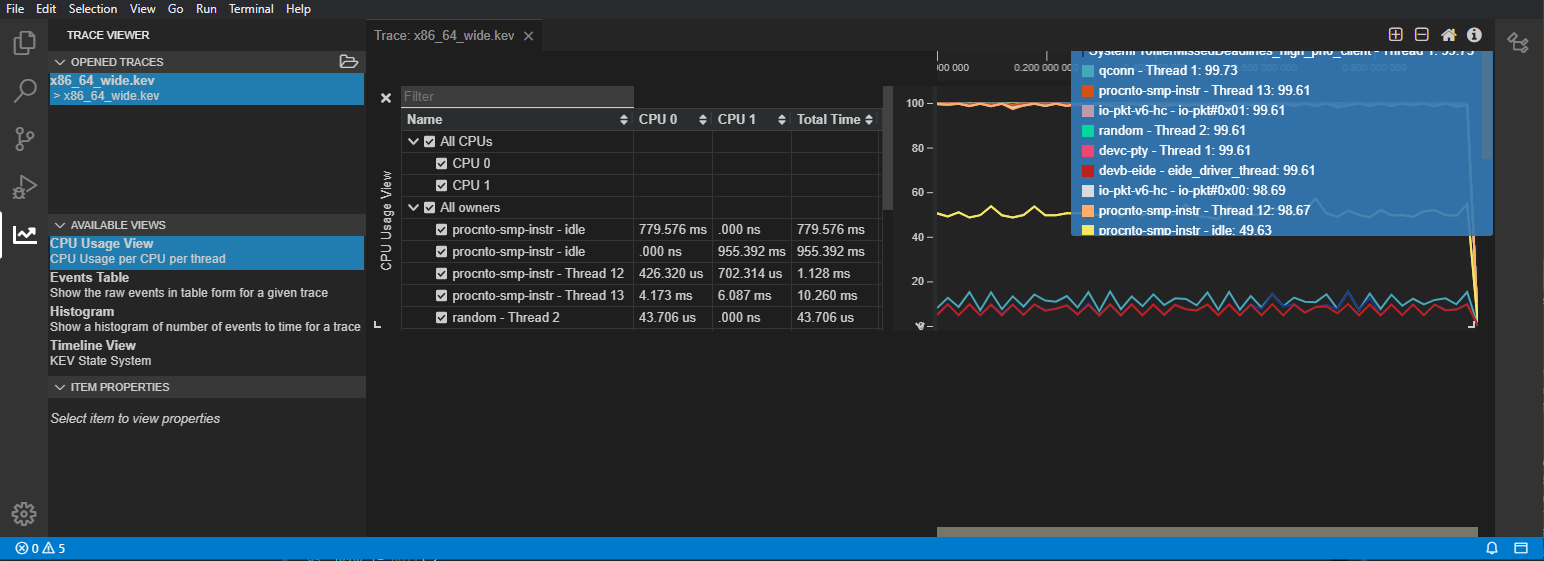
You can use the CPU Usage view to display recorded CPU usage statistics. You can zoom in / out over time, and filter the list of process owners to view CPU information.
Opening the view
CPU Usage is one of the dashboard views in the System Profiler.
To open the view:
- Click QNX SYSTEM PROFILER, then select a trace.kev file.
- Click DASHBOARDS > CPU Usage. The CPU Usage view is displayed:
Toolbar actions
You can take the following actions from the toolbar in the CPU Usage view:
| Toolbar action | Description |
|---|---|
| Automatically adjust the vertical scale (height), so that all content fits neatly in the view. Turn off to view 100% of the graph. | |
| Zoom in to reveal fine-grained detail on the CPU Usage. | |
| Zoom out to obtain a higher level overview of system activity. | |
| Reset zoom. | |
| Export the CPU Usage values to a CSV file with headers. | |
| Sync the CPU usage data with the owner and event filters in the System Profiler. | |
| Enable two-way sync between the CPU usage data and the other System Profiler views. This aligns all views to the same time window. |
Page updated: