Using the System Profiler
You can use the System Profiler to render different types of trace analysis, such as graphs and tables.
Kernel tracing is an analysis activity in which the instrumented kernel on a target logs information about kernel events. This information shows what's happening on the target at a system-wide level, so you can eliminate performance bottlenecks and optimize the interaction of processes and threads.
In QNX Toolkit, the System Profiler component allows you to examine the data generated by kernel event traces. These data describe events such as:
- kernel calls
- interrupts
- process and thread management activities
- system events related to adaptive partitioning and memory mapping
- context switches within a process
- message passing and signaling
Navigation
You can use zoom, pan, and resizing and rearranging controls when you view traces with the System Profiler.
To view the complete list of navigation shortcuts:
- From a running .kev file, click the Information
 icon at the top right of the
trace.
icon at the top right of the
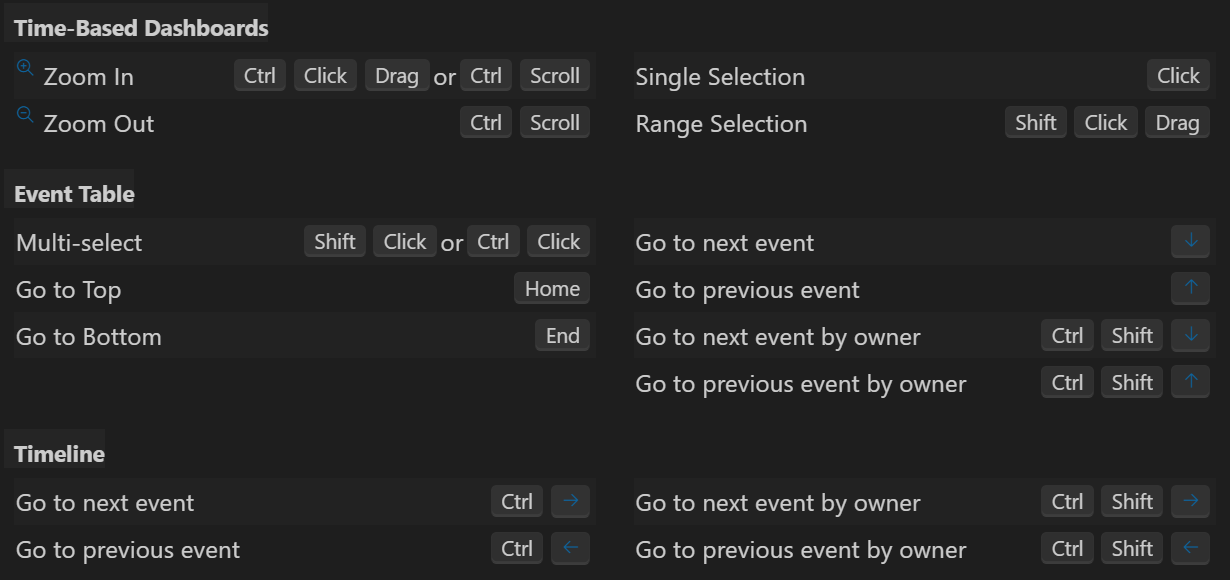
trace. - Click Trace Viewer Keyboard and Mouse Shortcuts. A
complete list of navigation shortcuts is displayed:
Exporting a table to CSV
You can export trace data to a CSV file for any of the dashboard views in the System Profiler.
To export to CSV:
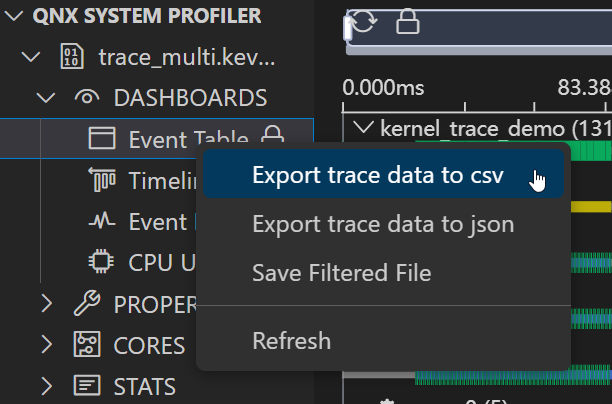
- From the System Profiler, right-click on one of the dashboard views (e.g., Event Table).
- Click Export trace data to csv:
The data are exported in CSV format as follows:
| View | Columns |
|---|---|
| Event Table | EventNum, TimeNs, Cycle, Cpu, ClassName, CodeName, OwnerFullName, FormattedData |
| Timeline View | TimeNs, OwnerFullName, FromState, ToState, Duration, Cpu, Priority |
| Event Density | TimeNs, Number |
| CPU Usage | OwnerFullName, TimeNs TOTAL, TimeNs CPU |
Using bookmarks
The System Profiler supports the Bookmarks feature, which helps you navigate between events across all dashboard views. You can add bookmarks from the Event Table or Timeline view and subsequently use them to view the bookmarked events on any of the dashboards.
To add a bookmark:
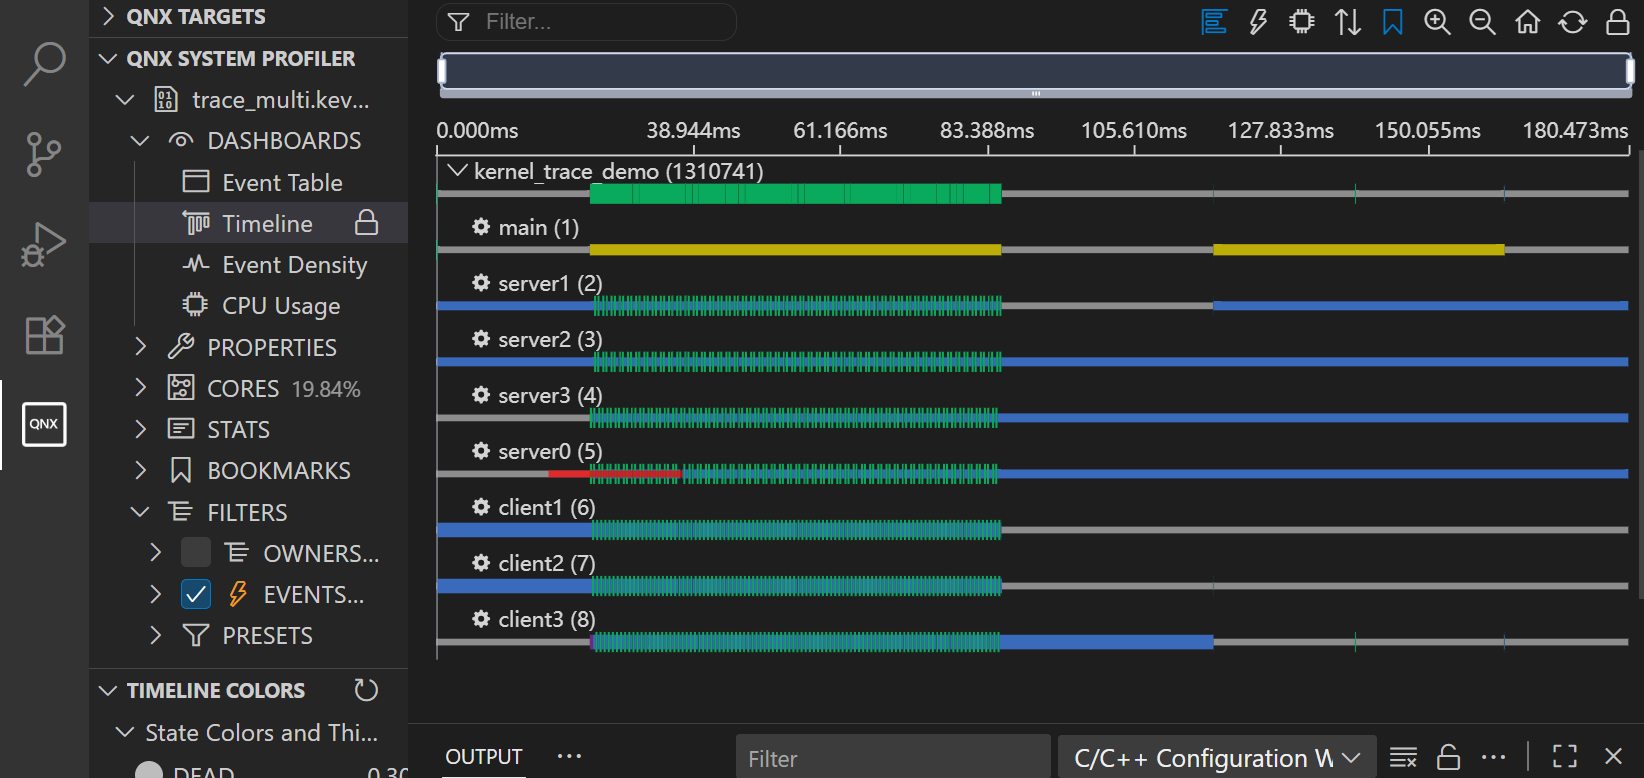
- From the System Profiler, click on the Event Table or Timeline view.
- Right-click the event you want to bookmark.A dropdown menu opens:
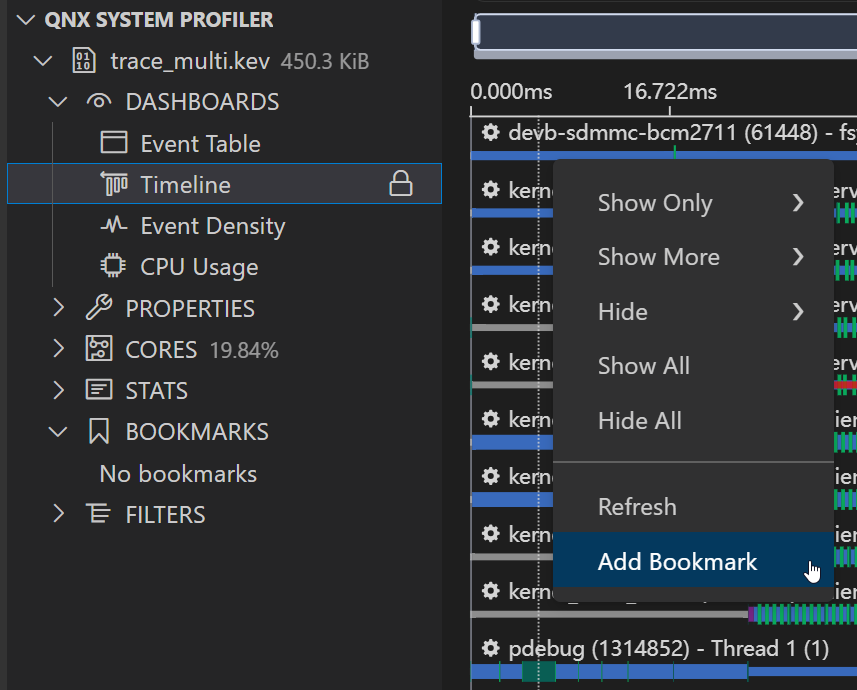
- Click Add Bookmark. An entry field opens:
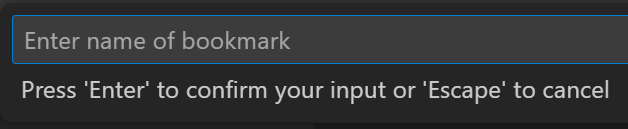
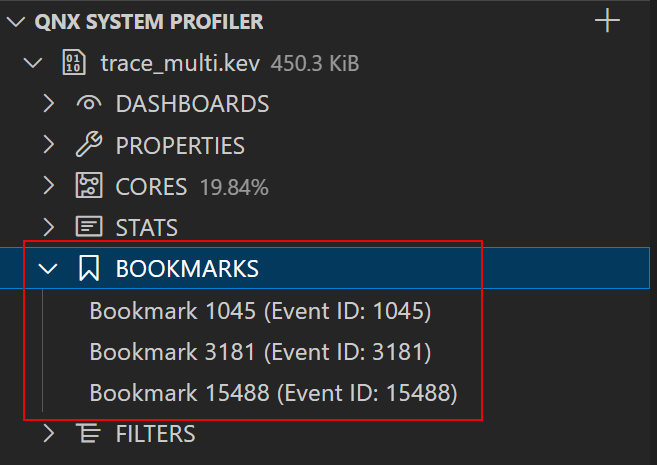
- Enter a name for your bookmark and hit Enter to
save.The bookmark appears on the list under BOOKMARKS:
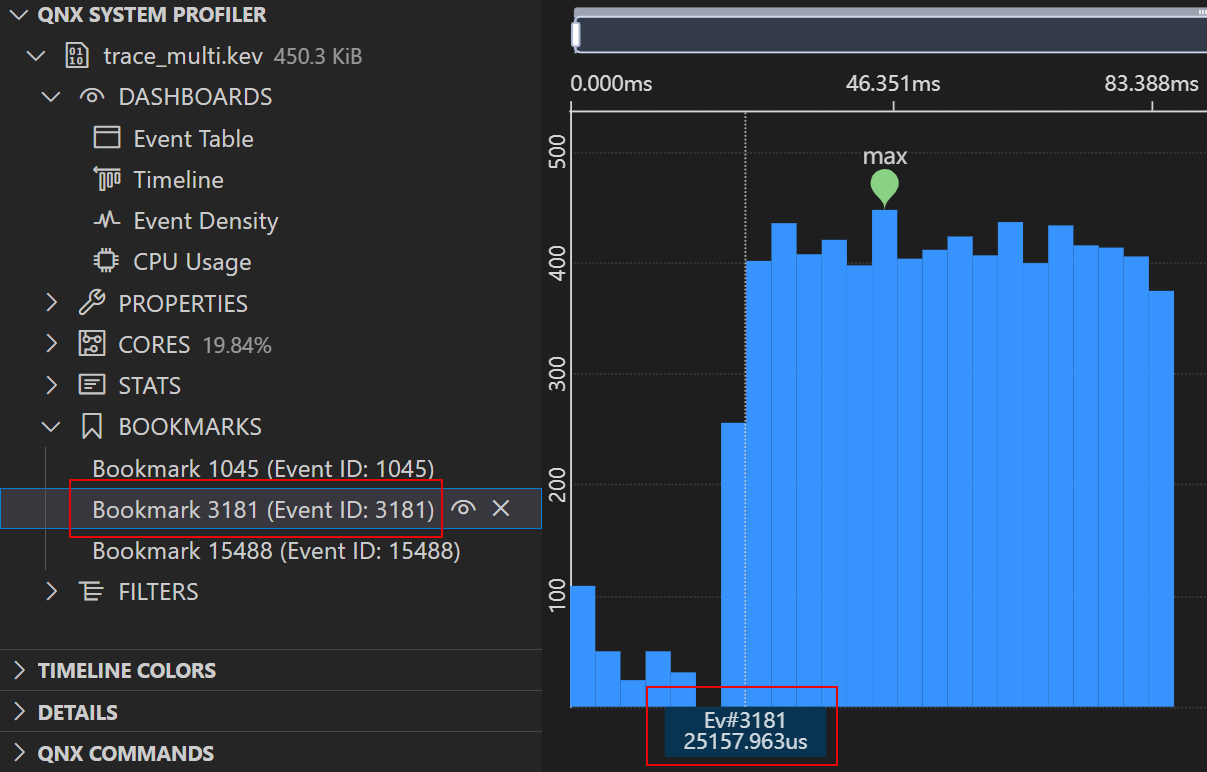
To go to a bookmarked event:
- From the System Profiler, click BOOKMARKS, then select the desired bookmark from the list.
- Go to any dashboard view.The bookmark appears next to the bookmarked event: