Event Table view
The Event Table view displays the raw events in table form. When you select an area of the Overview graph, the Event Table view updates to reflect the chosen data.
With this view, you can see every kernel event that occurred during the trace period and the exact order of the events. Because a trace has a large number of events (even in relatively short traces), you may want to use filtering to show only certain events and areas of interest.
Opening the view
Event Table is one of the dashboard views in the System Profiler.
To open the view:
- Click QNX SYSTEM PROFILER, then select a .kev file.
- Click DASHBOARDS > Event Table. The Event Table view is displayed:
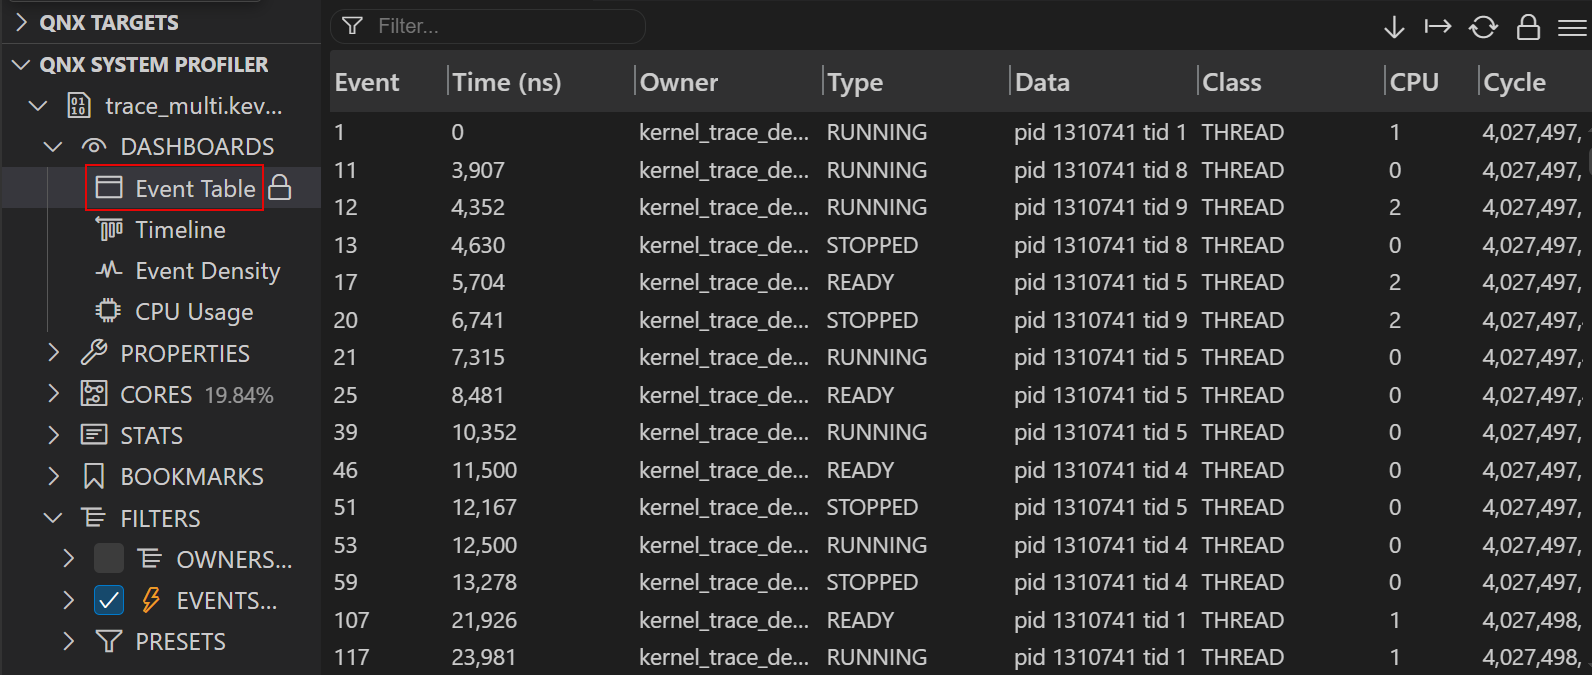
| Column | Description |
|---|---|
| Event | Event number. |
| Time (ns) | Timestamp when the event occurred in nanoseconds. |
| Owner | Owner of the event. |
| Type | Type of event. |
| Data | Data associated with the event. Often, the PID and TID are included; for message-related events, the message ID is included. |
| Class | Event class. |
| CPU | The CPU that the event relates to. |
| Cycle | CPU cycle. |
For more information about events, go to Classes and events
in the Events and the Kernel
chapter of the
System Analysis Toolkit User's
Guide.
Filtering the view
You can filter each column of the Event Table view.
To filter the view:
- Hover over the column title, then click the Filter
 icon.
icon. - Enter the desired criteria in the search field that opens, and the view is automatically updated.
You can filter each view using And / Or search functionality. You can also use the following search conditions:
| Search condition | Description |
|---|---|
| Contains | For text fields, the items must contain the search string to return. |
| Equals | Search items must be equivalent to return. |
| Does not contain | For text fields, the items must not match to return. |
| Does not equal | The items must not match to return. |
| Less than | Only items less than the value are returned. |
| Greater than | Only items greater than the value are returned. |
| Greater than or equal to | Only items greater than or equal to the value are returned. |
| Less than or equal to | Only items less than or equal to the value are returned. |
| Blank | For text fields, the items must be blank. |
| Not blank | For text fields, the items must not be blank. |