Using Graphviz
Graphviz is a utility library that helps generate graphs programmatically. There is a graphviz Python binding for the library.
The apk package manager can generate Graphviz graphs of package dependencies. This capability is leveraged during the prerequisite installation and set up for this example.
Install Graphviz
To help with cut and paste commands, select the Applications menu, then Internet > Web Resource > Self-Hosted Developer Desktop Guide to view this tutorial on your desktop.
Run the following command to install Graphviz and its related packages:
sudo apk add graphviz graphviz-dev graphviz-graphs python3-gvTest the installation by generating dependency graphs for the python3 package:
cd ~/projects/python_graphviz
sudo apk dot python3 > python3.gv
Generate the dependency graph in PNG format:
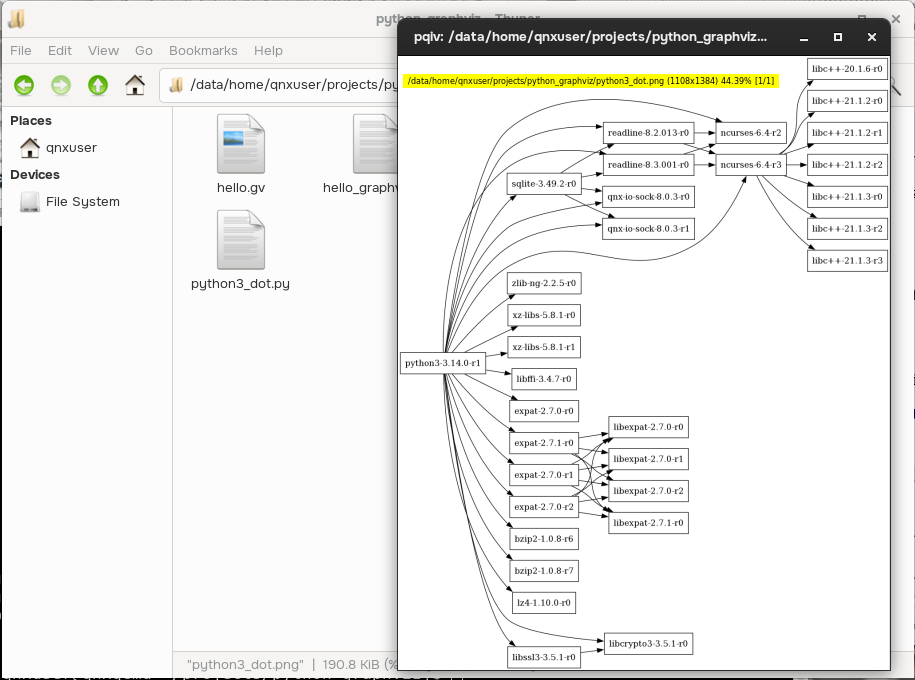
dot -Tpng python3.gv > python3_dot.pngOpen the project folder using the File Manager:
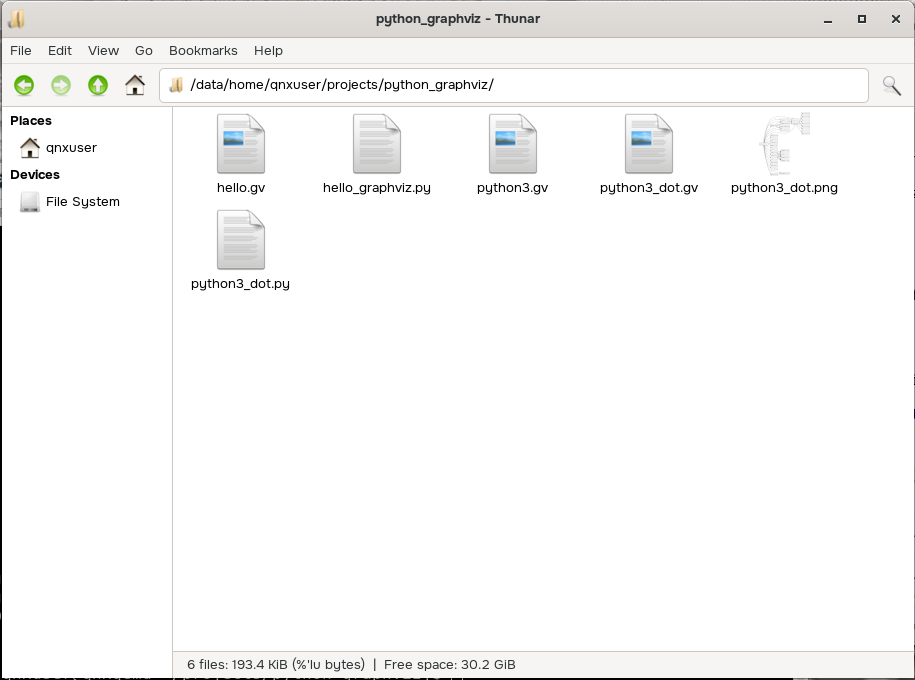
Open the graph using using your default image viewer to see it full size:
Prepare to work with Graphviz in Python
The following steps detail the perquisites required to use the Python viewer.
Run the following command to install the Python package:
pip3 install graphviz --break-system-packagesEdit /home/qnxuser/.local/lib/python3.14/site-packages/graphviz/backend/mixins.py:
vi /home/qnxuser/.local/lib/python3.14/site-packages/graphviz/backend/mixins.pyCopy the _view_linux static function and add it to the line below. Rename it _view_qnx, then save and quit:
_view_linux = staticmethod(viewing.view_unixoid)^M ^M _view_qnx = staticmethod(viewing.view_unixoid)^M ^MNote:The
^M's are representations of carriage returns in the editor.Edit /home/qnxuser/.local/lib/python3.14/site-packages/graphviz/backend/viewing.py:
vi /home/qnxuser/.local/lib/python3.14/site-packages/graphviz/backend/viewing.pyAdd a notation for
view_unixoidto attach it toqnx, similar to the existing attachment notation forlinux. Then, save and quit:@_tools.attach(view, 'linux')^M @_tools.attach(view, 'freebsd')^M @_tools.attach(view, 'qnx')^M
Run the sample script
Now, open Geany and try a sample script adapted from this resource: https://graphviz.readthedocs.io/en/stable/examples.html.
Graphviz's default format is PDF but the desktop environment doesn't include a PDF viewer. The following example opens a PNG viewer and exports a PNG file of the graph instead.
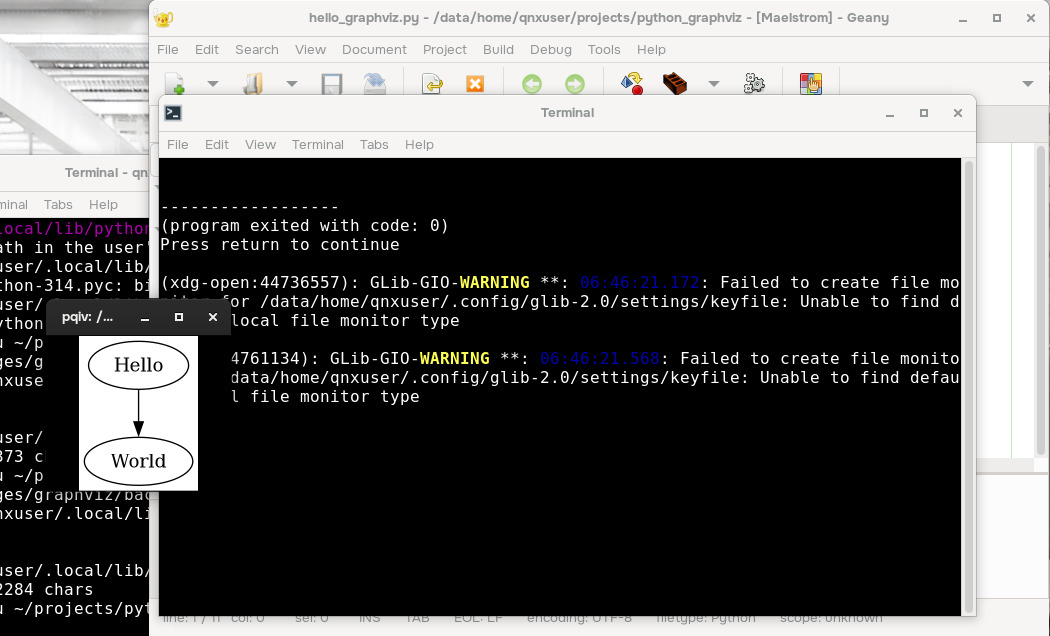
In Geany, open /home/qnxuser/projects/python_graphviz/hello_graphviz.py.
Select Build > Execute. This opens a "Hello, World!" graph in your default image viewer:
You can also access the graph from the File Manager. Right-click the hello_world.gv.png file and open it with your image viewer.
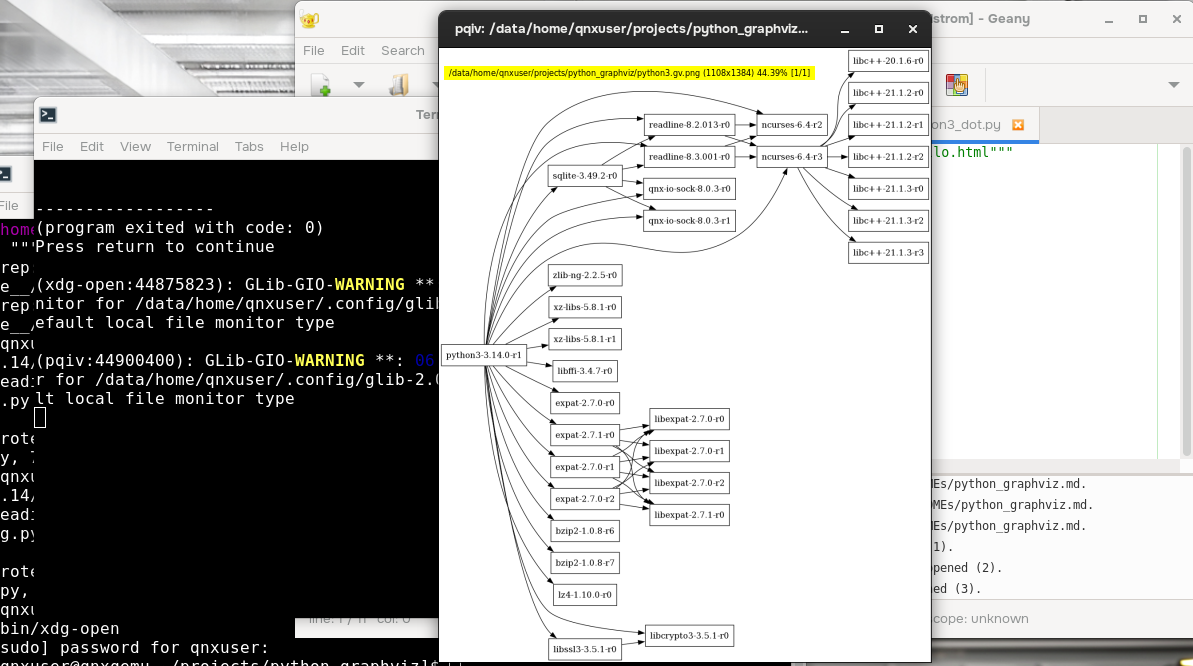
Open python3_dot.py and execute it to see the dependency graph for the python3 package in your image viewer:
Next steps
You can also try to adapt the sample scripts in Graphviz's "Example" section to run in the environment: https://graphviz.readthedocs.io/en/stable/examples.html.
Similarly to the example above, you need to adapt the initialization to include setting the format. To do so, create the sample script locally and copy it into the VM with scp. Then, open it from within the desktop environment.