Trace Properties view
Updated:
This view enables you to view the properties of the trace.kev file.
Creating the view
With a running trace server and trace compass extension, the Trace Properties View is available from the Views panel in the System Profiler.
To create the view:
- Click Trace Properties View in the Views panel of the Trace Server.
- The table of properties is displayed.
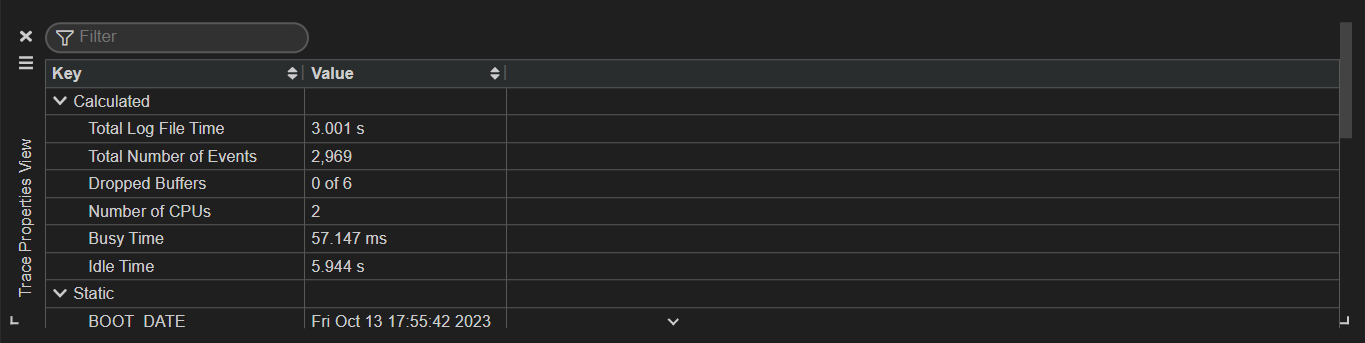
The available types are as follows:
| Key | Value |
|---|---|
| Calculated | |
| Total Log File Time | The total time span covered by the trace log. |
| Total Number of Events | The count of individual events captured in the trace log. |
| Dropped buffers | The number of event buffers that were not recorded due to buffer overflow or other reasons. |
| Number of CPUs | Number of CPUs. |
| Busy time | The cumulative time during which the CPU was actively processing tasks. |
| Idle time | The cumulative time during which the CPU was not actively processing tasks. |
| Static | |
| BOOT_DATE | The system's boot date and time. |
| CPU_NUM | The number of CPUs on the system. |
| CYCLES_PER_SEC | The number of clock cycles per second for the CPU. |
| DATE | The date and time when the trace was captured. |
| ENCODING | The size of each event entry in the trace. |
| FILE_NAME | The path to the trace file. |
| LITTLE_ENDIAN | The endianness of the system. |
| MACHINE | The type of machine or architecture. |
| NODENAME | The network name of the machine. |
| NORMALIZEDN | Numerical value that indicates that the trace was normalized by IDE. |
| SYSNAME | The operating system name. |
| SYSPAGE_LEN | The length of the system page. |
| SYS_RELEASE | The release version of the operating system. |
| SYS_VERSION | The build date and time of the operating system. |
| TRACELOGGER_ARGS | Tracelogger arguments. |
| VER_MAJOR | The major version number of the trace system. |
| VER_MINOR | The minor version number of the trace system. |