Timeline view
Updated:
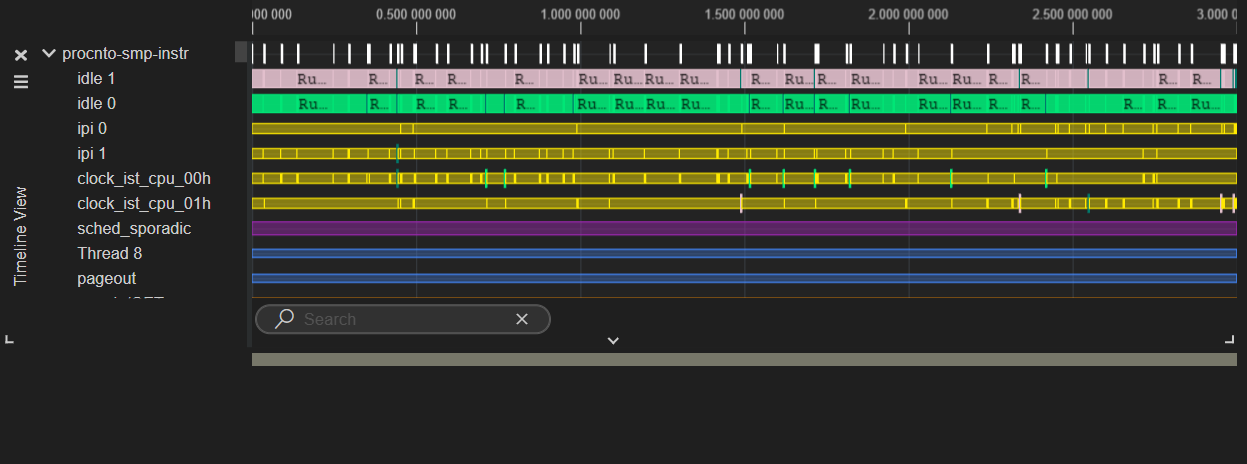
The Timeline view shows the chronology of the logged kernel events of a trace.kev file. Hover over the color bands to display relevant information.
Creating the view
The Timeline view is available from the Views panel in the System Profiler.
To create the view, click Timeline View.
A timescale shows the start time and end time of the trace file and highlights the currently selected time frame.
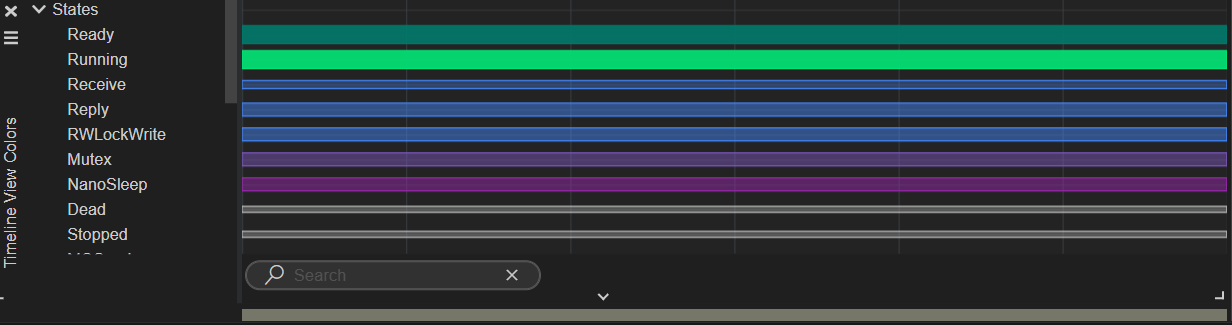
Timeline View Colors view
Timeline View Colors view is the legend for the colors in the Timeline View.
The view displays two tabs:
- Colors for the states.
- Colors for the CPUs.
Note:
You cannot currently change the color scheme.
To create the view, click Timeline View Colors.
The legend for States and CPU Colors is displayed.