Managing traces
Updated:
Opening a trace file starts the Trace Server and opens the System Profiler.
Opening a trace
To open a trace:
- In the file system of your Workspace, locate the trace.kev file.
- Click the file. The Trace Server starts, and the System Profiler displays the views.
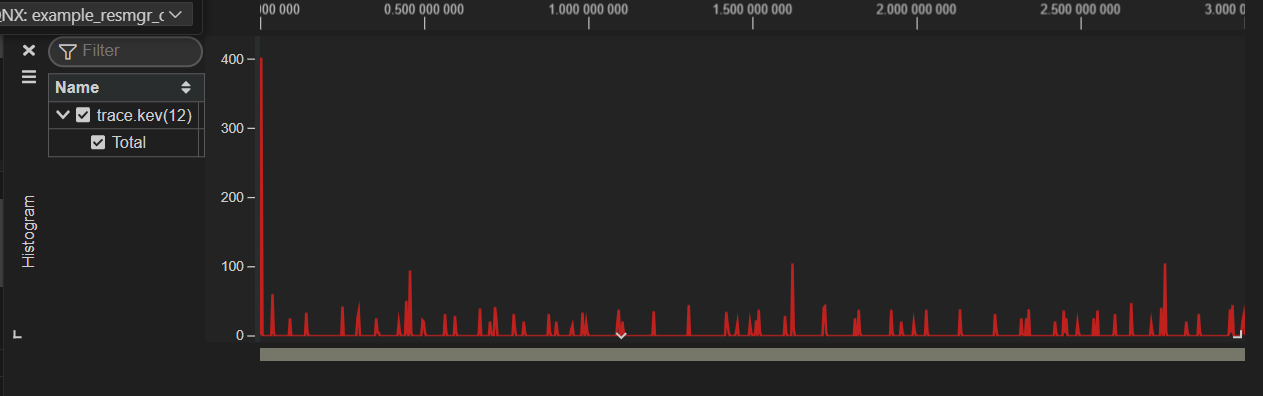
By default, the Histogram is displayed first,
although this can be changed to the CPU Usage View.
Go to
Using the System Profiler
for more information.
Closing a trace
To close a trace:
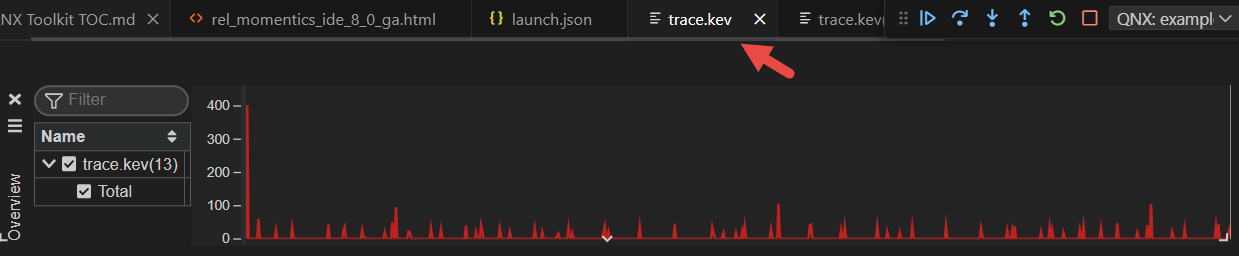
- In the VS Code file browser, locate the tab allocated to the trace.kev file.
- Close the tab to close the trace.kev file.
Removing traces from the System Profiler
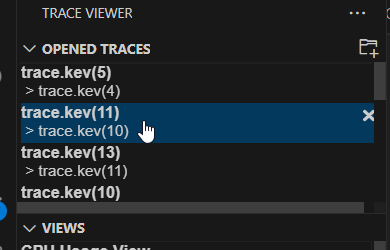
To remove a trace:
- In the System Profiler, expand From OPENED TRACES, and then click x next to the trace that you want to remove. The trace is removed.
Event decoding
You can insert user events into the event stream. This is useful for flagging events or bracketing groups of events to isolate them for study. You can provide custom event data formatting for the custom user events; you must provide an event definition file describing the data format for the custom user events. Go to Classes and Events for more information.
To upload the file:
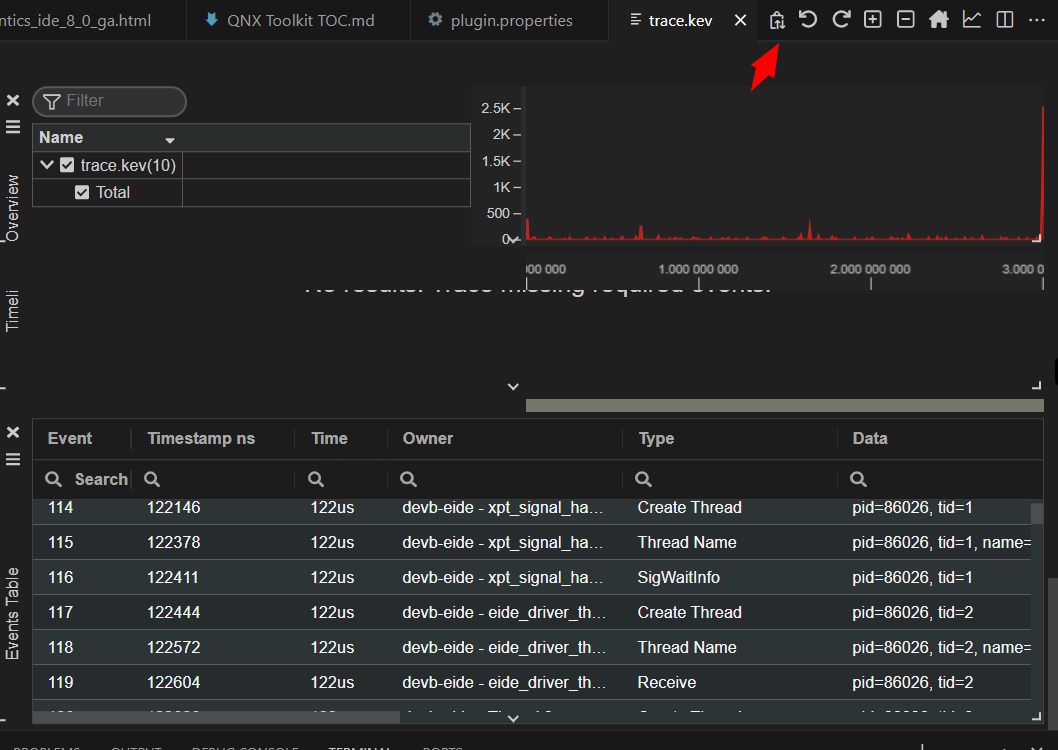
- Make sure that you have a running trace server.
- Click on the User Event Data Formattingbutton at the top right of the interface. The settings are opened, where you can specify the path to the user events definition file.
User Event Example:
<eventformatting>
    <datakey format="%4u1x state %d seq_id">
        <event class="6" id="22"/>
        <enum name="state" value="0x0" string="INPUT_RECEIVED"/>
        <enum name="state" value="0x1" string="START_PROCESSING"/>
        <enum name="state" value="0x2" string="END_PROCESSING"/>
        <enum name="state" value="0x3" string="REQUEST_RENDER"/>
        <enum name="state" value="0x4" string="RENDER_COMPLETE"/>
    </datakey>
</eventformatting>
Important:
You need a corresponding trace file with user events to test event decoding.