Using the System Profiler
You can use the System Profiler to render different types of trace analysis, such as graphs and tables.
Kernel tracing is an analysis activity in which the instrumented kernel on a target logs information about kernel events. This information shows what's happening on the target at a system-wide level, so you can eliminate performance bottlenecks and optimize the interaction of processes and threads.
In QNX Toolkit, the System Profiler component allows you to examine the data generated by kernel event traces. These data describe events such as:
- kernel calls
- interrupts
- process and thread management activities
- system events related to adaptive partitioning and memory mapping
- context switches within a process
- message passing and signaling
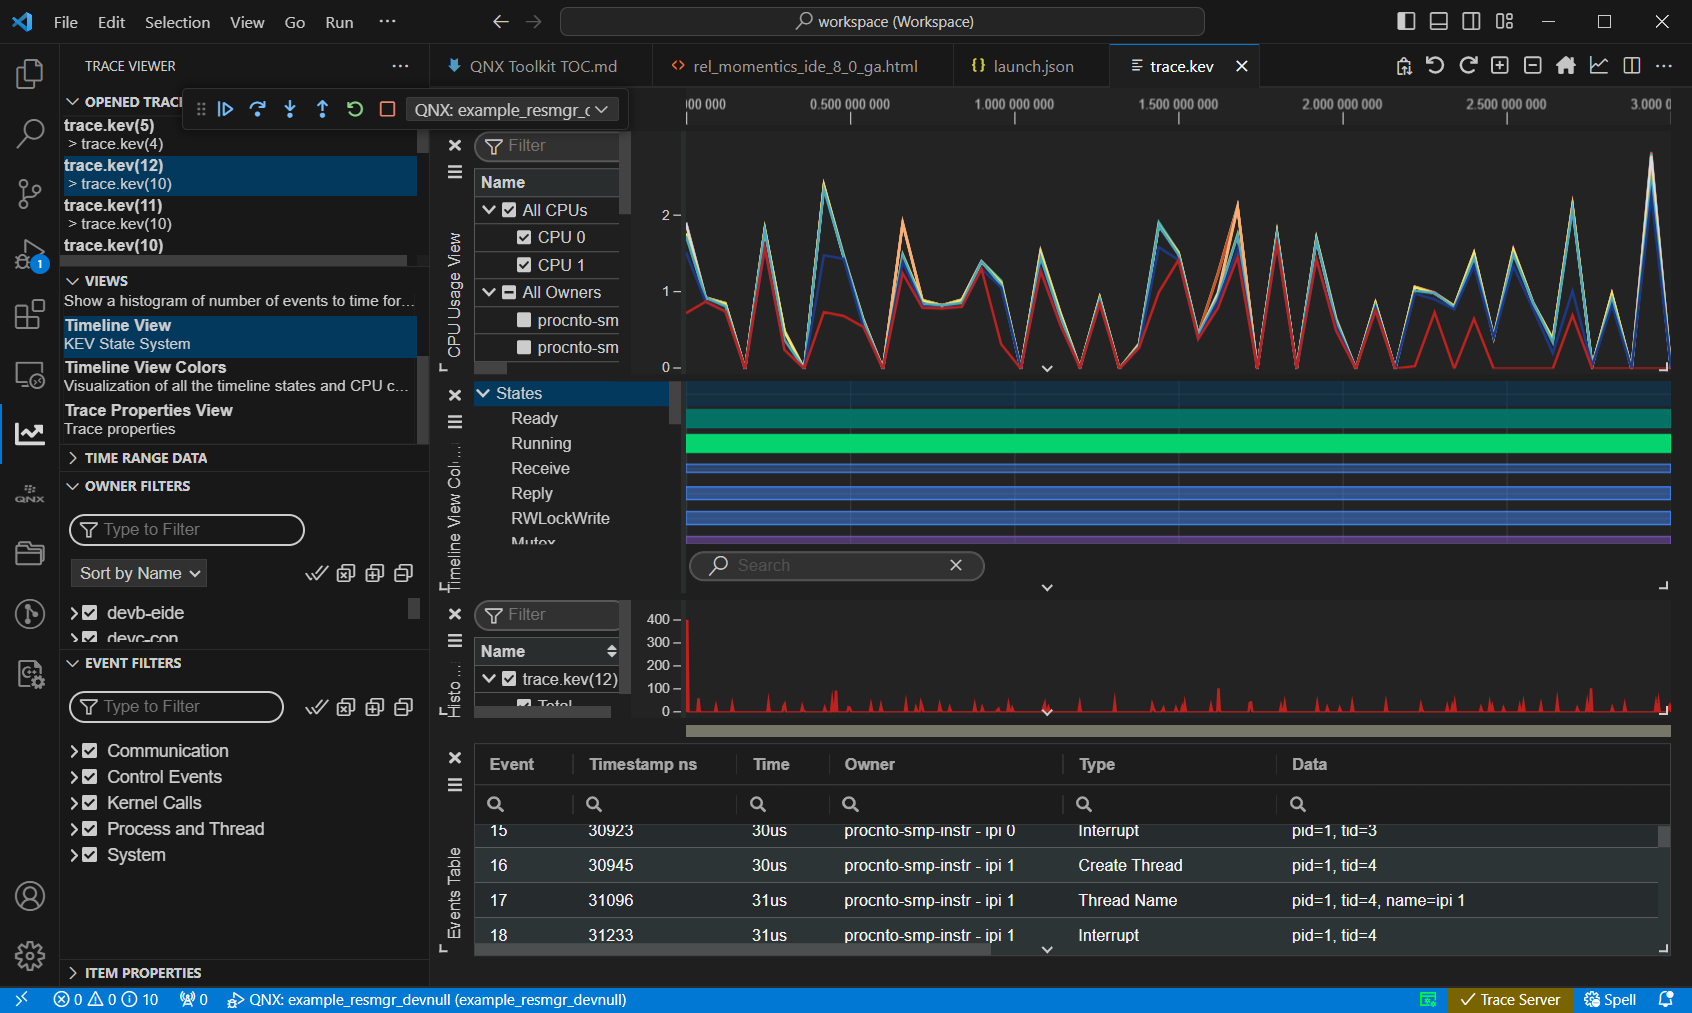
The System Profiler includes different analysis views such as CPU Usage View, Histogram, and Timeline View. You can re-arrange them by dragging and dropping, and you can re-size by dragging the corners of the individual views. You can close views to simplify the display. Clicking one of the views updates and synchronizes the data across all the views. In the Events Table view, you can re-arrange the columns by clicking and dragging them.
Overview view
The default view is Histogram, but you can change it to CPU Usage.
To change the Overview view:
- Click the hamburger menu in the Overview panel of the System Profiler.
- Click Select source output.
- Click CPU Usage View or Histogram.
- Click Close.
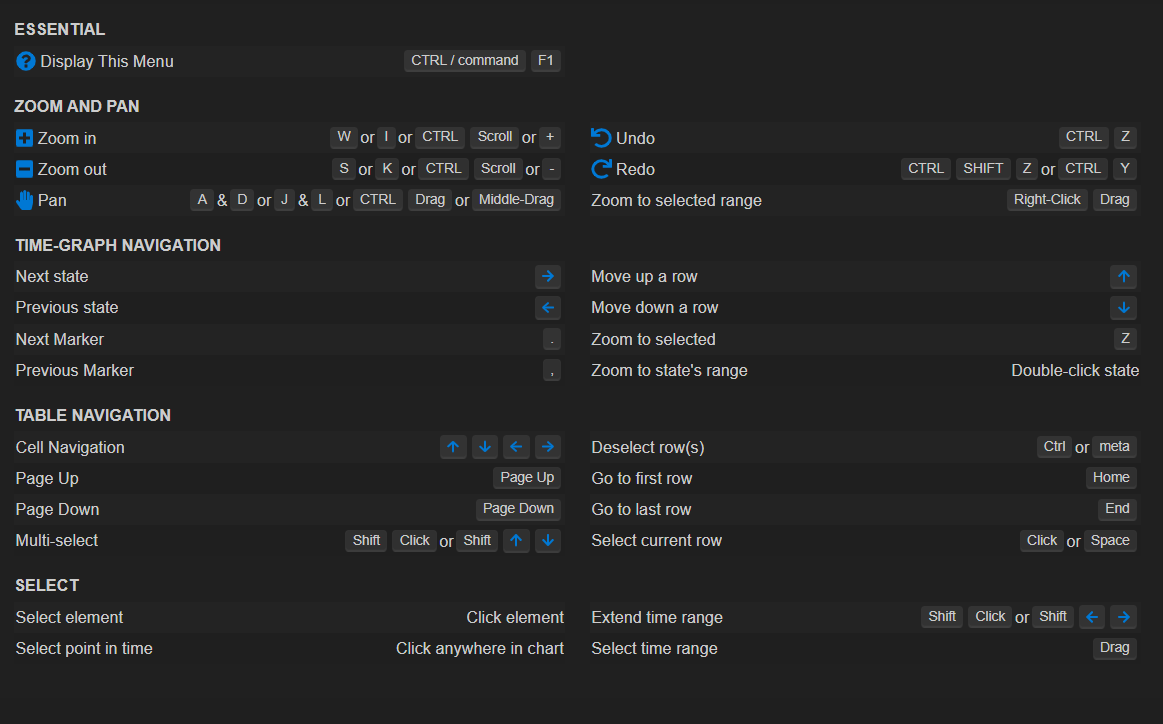
Navigation
You can use zoom, pan, and resizing and rearranging controls when you view traces with the System Profiler.
To view the complete list of navigation shortcuts:
- From a running trace.kev file, click the three dots at top right.
- Click Trace Viewer Keyboard and Mouse Shortcuts. A complete list of navigation shortcuts is displayed.
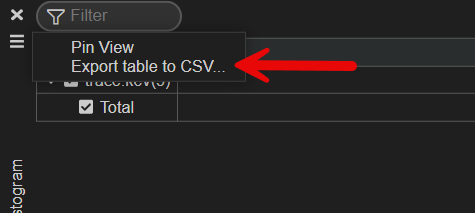
Export table to CSV
Several of the views include an export to CSV feature.
To export to CSV:
- From a supported view (eg., Histogram), click the hamburger.
- Click Export table to CSV. The data is exported in .csv format.