Using the debugger
QNX Toolkit1.1QNX Toolkit User's GuideDeveloperSetup
You can use the DEBUG CONSOLE, the RUN AND DEBUG view, and the RUN AND DEBUG controls to help you with the debugging process.
Using the Debug Console
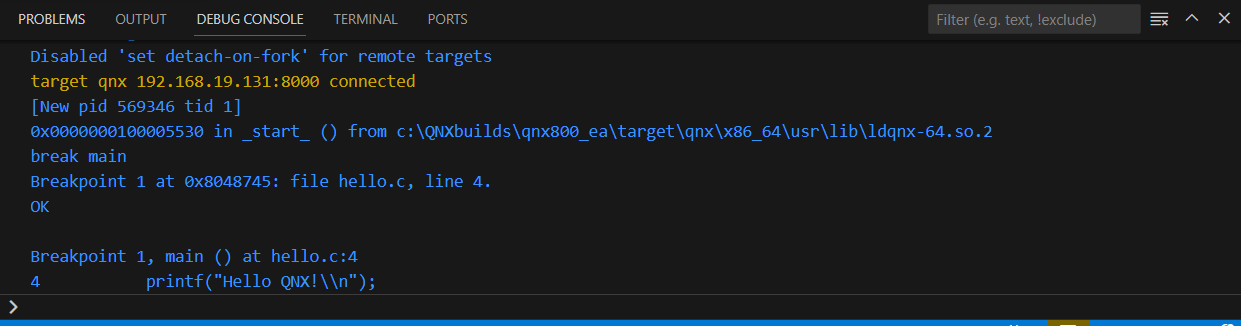
You can use the DEBUG CONSOLE to view information about the debugging process.
You can also use it to enter GDB commands:
Using the Run and Debug view
You can use the RUN AND DEBUG view to help you with the debugging process. For example, examining call stacks is useful for seeing when an application's functions were executed relative to other system events. When you step through your code, the QNX Toolkit populates the Call Stack view with the call sequences that were active. You can double-click a call stack entry to open the associated source file at the corresponding line of code: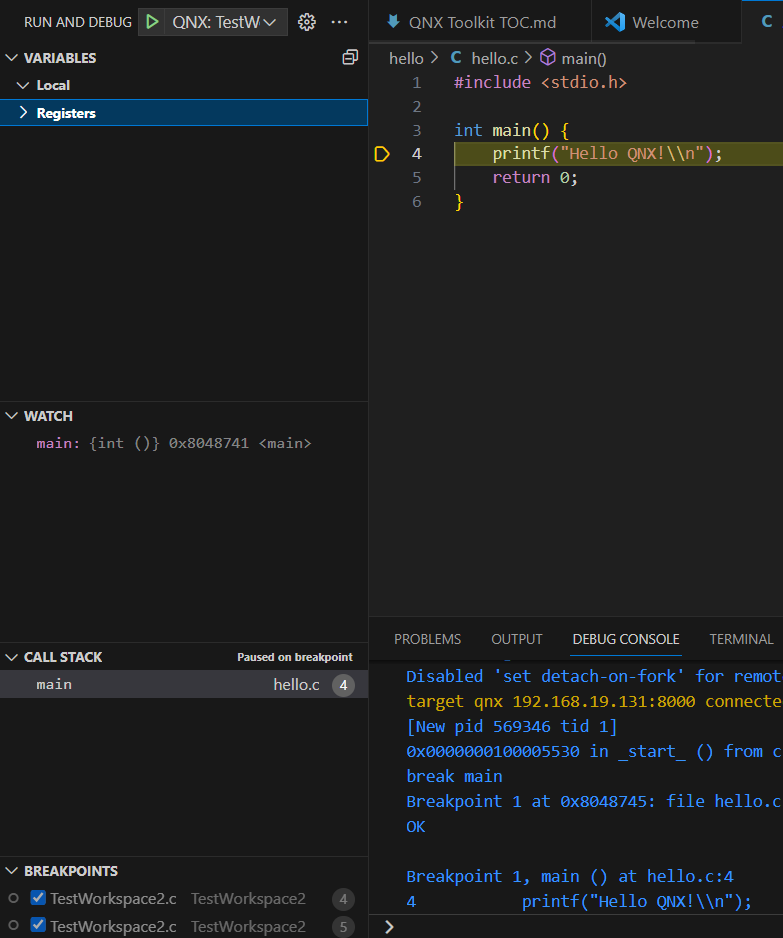
The different debugger views are as follows:
| Column | Description |
|---|---|
| VARIABLES | View local variables and registers. |
| WATCH | Add watchpoints that dynamically update as you step through the code. |
| CALL STACK | Examine the thread call stacks for a particular time point in the code. |
| BREAKPOINTS | View and manage data breakpoints. |
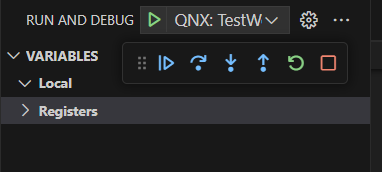
Using the Run and Debug controls
You can use the RUN AND DEBUG controls to help you with the
debugging process.
| Button | Description |
|---|---|
| Start execution of a program. | |
| Resume debugging of a currently suspended program until the next breakpoint or the end fo the program. | |
| Execute the current line, then suspend execution at the next line. | |
| Execute the current line, including the code inside of any routines, and proceed to the next statement. | |
| Continue exectuion within the current line, then suspend the program and return to the calling code. | |
| Restart execution of a program. |
Page updated: