Launching an application
You can launch an application with or without the debugger. To debug an application, you can also attach the debugger to an already running process.
Launching an application without the debugger
To launch an application without the debugger, follow the steps below:
- In the Explorer, right-click the project folder.
A menu opens.
- Hover over QNX to expand the menu options:
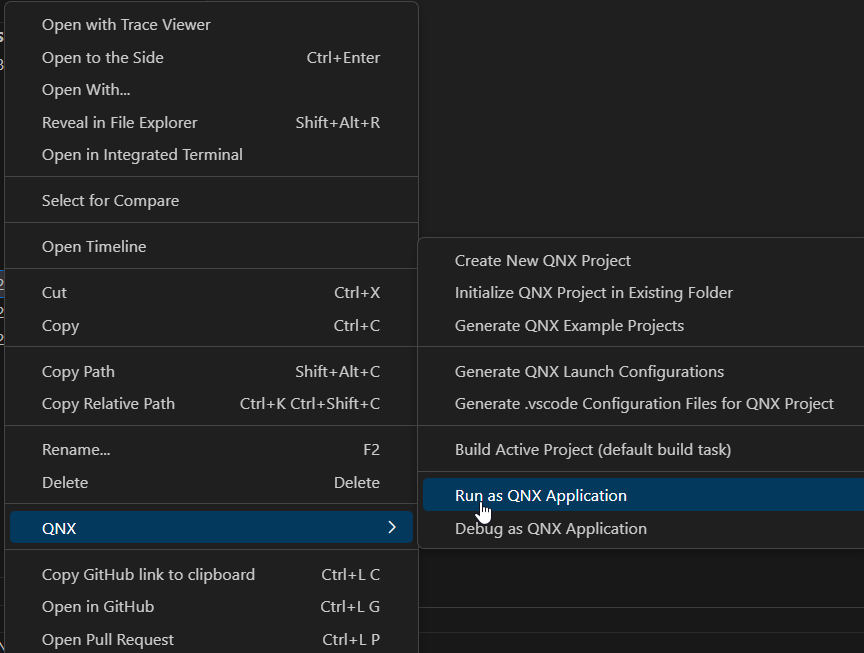
- Click Run as QNX Application....
- If you have only one launch configuration, the QNX Toolkit automatically selects it.
- If you have multiple launch configurations, a prompt to select one appears. Select a launch configuration from the palette.
- The QNX Toolkit uses the selected configuration to build and launch the
program. Note:Alternatively, to run your application without the debugger, click the Bug
 icon in the Primary Side Bar to open the RUN
AND DEBUG view. Then, select your launch configuration
from the dropdown list and press CTRL+F5.
icon in the Primary Side Bar to open the RUN
AND DEBUG view. Then, select your launch configuration
from the dropdown list and press CTRL+F5. 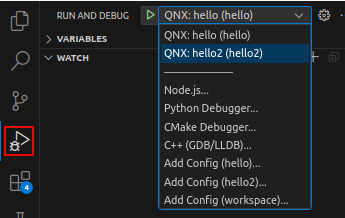
Launching an application with the debugger
You can launch an application with the debugger or, if your application is already running without the debugger, you can attach the debugger to it.
To launch an application with the debugger using the Explorer interface, follow the steps below:
- From the workspace, right-click the program's project folder.
- Navigate to QNX and open the dropdown menu on the right.
- Click Debug as QNX Application....
- Select the launch configuration for debugging. The QNX Toolkit runs and debugs
the program.Note:Alternatively, to debug your application, click the Bug icon in the Primary Side Bar to open the RUN AND DEBUG view. Then, select your launch configuration from the dropdown list and press F5.
Attaching the debugger to a running application
If you've previously launched your QNX application without the debugger, and want to attach the debugger to it while it is running, follow the steps below:
- From QNX TARGETS, expand the PROCESSES folder.
- Right-click on a process on the target which you previously launched.
- Click Attach Debugger to QNX Process. The IDE attaches the debugger to the selected process and stops execution immediately. The RUN AND DEBUG view displays information about the active threads and their stack frames.
Workaround for postmortem debugging
While postmortem debugging of core files isn't supported, you can implement a workaround by adding the following code snippet to your launch.json file:
{
    "version": "2.0.0",
    "configurations": [
       {
          "type": "cppdbg",
          "request": "launch",
          "name": "QNX: debug core dump",
          "program": "${workspaceFolder}/myprogram",
          "stopAtEntry": false,
          "coreDumpPath": "${workspaceFolder}/myprogram.core",
          "cwd": "${workspaceFolder}",
          "MIMode": "gdb",
          "miDebuggerPath": "${env:QNX_HOST}/usr/bin/ntox86_64-gdb"
       }
     ]
}