Running a Kernel Trace on an Example Application
You can run a kernel trace on an example application.
You will learn to
- Build a sample program designed to demonstrate inter-thread communication and tracing
- Modify VS Code's launch.json file to add multiple launch configurations for tracelogger
- Review trace results in the System Profiler
Prerequisites
This tutorial assumes the following:
- You've installed QNX SDP 8 using the QNX Software Center (QSC)
- You've installed QNX Toolkit 1.1 extension for Microsoft VS Code
- You have a QNX target running on Raspberry Pi 4, VMware, or similar
Create a VS Code project folder
To create the folder:
- Create a folder called kernel_trace_demo in the location of your choosing.
- In VS Code, click File > Open Folder and choose the folder you just created.
- VS Code should prompt you to generate the project template automatically. If not, click QNX Commands > Projects > Generate Project Template.
- When prompted in VS Code, select QNX Recursive Makefile, c, Executable.
The standard program is generated for you in the VS Code Explorer.
Add the project code
You need to add the sample app code to run it in your environment.
To add the sample code:
- Copy and paste the contents of the file kernel_trace_demo.c into your program's file of the same name, overwriting the "hello world" content.
Go to Appendix
for more information.
Modify the configuration
- Start tracelogger as a daemon process
- Launch the executable with various command-line options
- Run tracelogger alongside your executable launch configuration
To do so, paste the following launch configurations into your launch.json file.
Start tracelogger as a daemon process:
This configuration starts tracelogger in the background where it runs as a passive process until a program explicitly enables it:
{
      "type": "qnx-gdb",
      "request": "launch",
      "name": "start tracelogger daemon",
      "gdb": "none",
      "qnxtarget" : "default",
      "stopAtEntry": false,
      "program": "tracelogger",
      "args": [
        "-d1", // Daemon mode
        "-s4", // Stop after 4 seconds
        "-E", // Enable Events
        "-c", // Continuous mode
        "-f/tmp/trace.kev" // Save to path
      ],
      "upload": false,
      "files": [
        {
          "operation": "download",
          "remotePath": "/tmp/trace.kev",
          "hostPath": "trace_${command:qnx.timestamp}.kev"
        }
      ]
    },
Launch the executable with various command-line options:
These launch configurations are set up to run the QNX kernel trace demo with different thread counts. Both upload the binary, run it on the QNX target, and use the default build task before launching:
 {
      "type": "qnx-gdb",
      "request": "launch",
      "name": "QNX: kernel_trace_demo",
      "gdb": "gdb",
      "program": "${command:qnx.autodetectBinary}",
      "args": [
        "-s1",
        "-c4",
        "-n100"
      ],
      "remotePath": "kernel_trace_demo",
      "qnxtarget": "default",
      "upload": true,
      "stopAtEntry": false,
      "preLaunchTask": "${defaultBuildTask}"
    },
    {
      "type": "qnx-gdb",
      "request": "launch",
      "name": "QNX: kernel_trace_demo multi",
      "gdb": "gdb",
      "program": "${command:qnx.autodetectBinary}",
      "args": [
        "-s4",
        "-c4",
        "-n100"
      ],
      "remotePath": "kernel_trace_demo",
      "qnxtarget": "default",
      "upload": true,
      "stopAtEntry": false,
      "preLaunchTask": "${defaultBuildTask}"
    }
Run tracelogger alongside your executable launch configuration:
This configuration defines two compound launch configurations; each starts both the tracelogger daemon and the kernel trace demo together, making it easy to capture trace data while the program runs:
],
  "compounds":
  [
    {
      "name": "QNX: kernel_trace_demo + trace",
      "configurations": ["start tracelogger daemon", "QNX: kernel_trace_demo"]
    },
    {
      "name": "QNX: kernel_trace_demo multi + trace",
      "configurations": ["start tracelogger daemon", "QNX: kernel_trace_demo multi"]
    }
  ]
Complete configuration:
The following represents a complete configuration for the program's launch.json file:
{
  "version": "2.0.0",
  "configurations": [
    {
      "type": "qnx-gdb",
      "request": "launch",
      "name": "start tracelogger daemon",
      "gdb": "none",
      "qnxtarget" : "default",
      "stopAtEntry": false,
      "program": "tracelogger",
      "args": [
        "-d1", // Daemon mode
        "-s4", // Stop after 4 seconds
        "-E", // Enable Events
        "-c", // Continuous mode
        "-f/tmp/trace.kev" // Save to path
      ],
      "upload": false,
      "files": [
        {
          "operation": "download",
          "remotePath": "/tmp/trace.kev",
          "hostPath": "trace_${command:qnx.timestamp}.kev"
        }
      ]
    },
    {
      "type": "qnx-gdb",
      "request": "launch",
      "name": "QNX: kernel_trace_demo",
      "gdb": "gdb",
      "program": "${command:qnx.autodetectBinary}",
      "args": [
        "-s1",
        "-c4",
        "-n100"
      ],
      "remotePath": "kernel_trace_demo",
      "qnxtarget": "default",
      "upload": true,
      "stopAtEntry": false,
      "preLaunchTask": "${defaultBuildTask}"
    },
    {
      "type": "qnx-gdb",
      "request": "launch",
      "name": "QNX: kernel_trace_demo multi",
      "gdb": "gdb",
      "program": "${command:qnx.autodetectBinary}",
      "args": [
        "-s4",
        "-c4",
        "-n100"
      ],
      "remotePath": "kernel_trace_demo",
      "qnxtarget": "default",
      "upload": true,
      "stopAtEntry": false,
      "preLaunchTask": "${defaultBuildTask}"
    }
  ],
  "compounds":
  [
    {
      "name": "QNX: kernel_trace_demo + trace",
      "configurations": ["start tracelogger daemon", "QNX: kernel_trace_demo"]
    },
    {
      "name": "QNX: kernel_trace_demo multi + trace",
      "configurations": ["start tracelogger daemon", "QNX: kernel_trace_demo multi"]
    }
  ]
}
Launch the programs
After you've modified the launch configurations, you can launch the associated programs in VS Code. To run the programs:
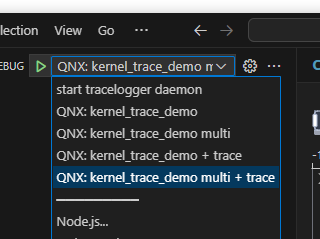
- From VS Code, click Run and Debug.
- From the dropdown, select the program you want to run. The "multi" programs launch with multiple servers.
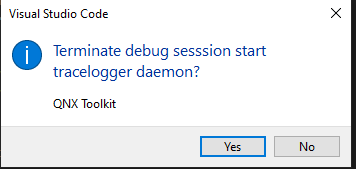
- Click No when prompted to terminate the debug session.
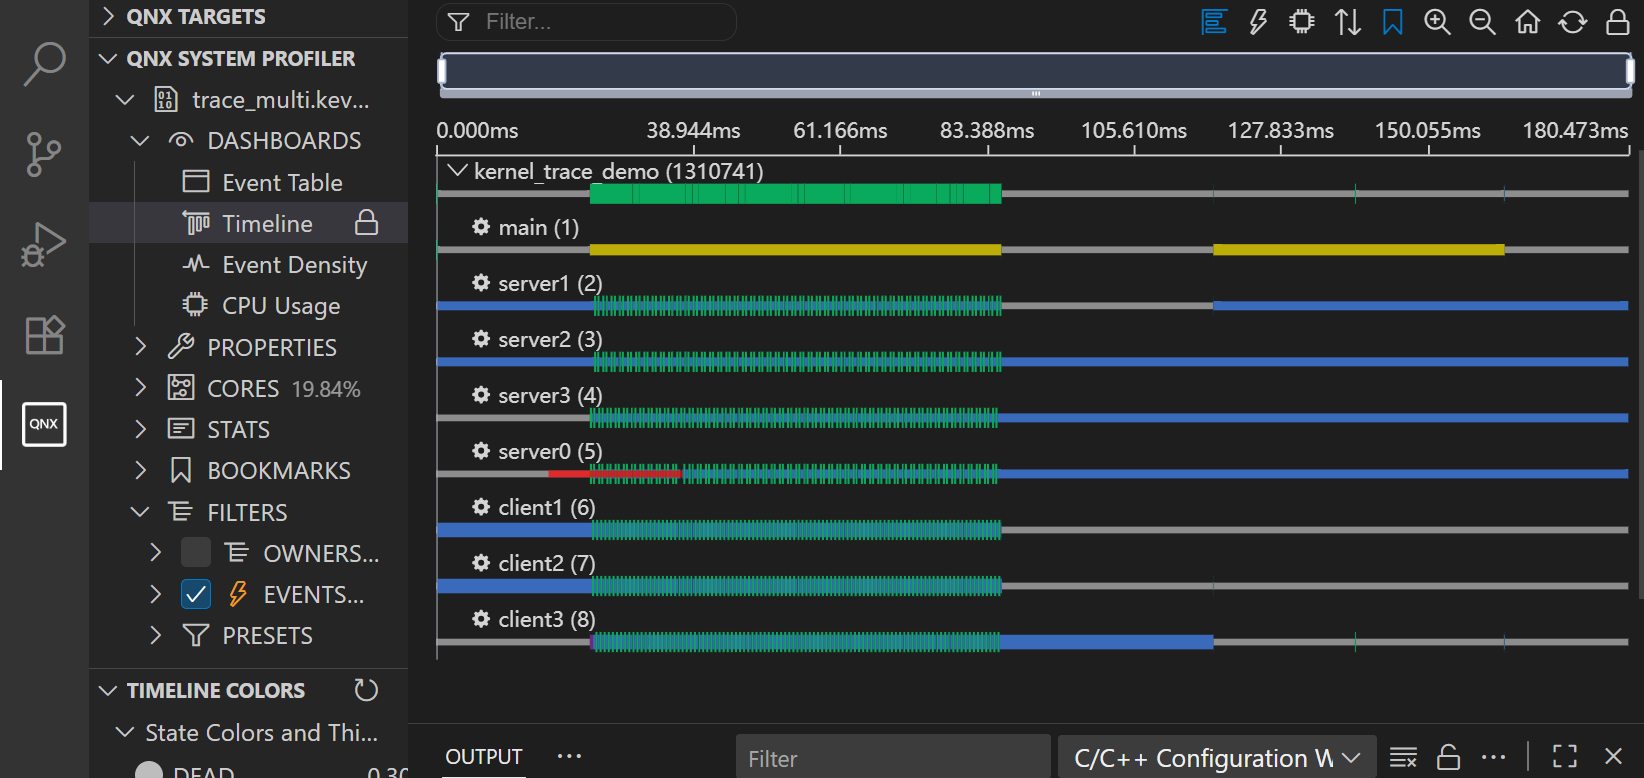
- Click on the trace.kev file to view the screens of the System Profiler.
You can then view the results of the program tracing from the System Profiler Dashboard views, including the Timeline and CPU Usage views.
Timeline:
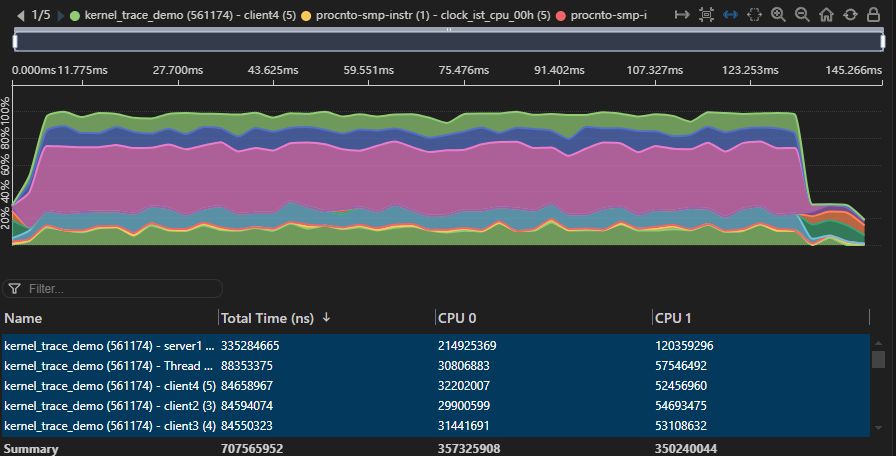
CPU Usage:
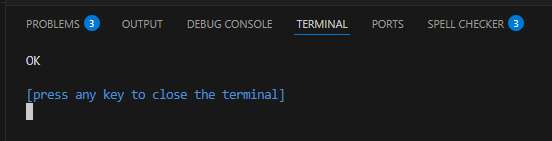
Viewing program output
If the program runs successfully, then you'll see "OK" in the terminal output:
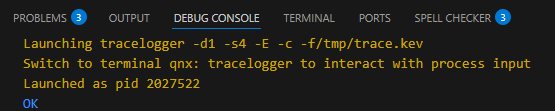
You'll also see separate output related to debugging in the debug console:
Appendix
You need to add the sample app code to run it in your environment.
To add the sample code:
- Copy and paste the contents of the file kernel_trace_demo.c into your program's file of the same name, overwriting the "hello world" content.
#include <stdio.h>
#include <stdlib.h>
#include <inttypes.h>
#include <sys/neutrino.h>
#include <sys/netmgr.h>
#include <sys/syspage.h>
#include <unistd.h>
#include <string.h>
#include <pthread.h>
#include <time.h>
#include <errno.h>
#include <sys/mman.h>
#include <sys/trace.h>


#define WORK_TIME_US 300

//#define DO_PRINT 1
#define DO_TRACE 1

// This is the max message size for this program.
#define MAX_MSG_SIZE (256)

// Max threads in this demo.
#define MAX_THREADS (32)

// Global variables
int channel_id;
int client_threads = 4;
int server_threads = 1;
int delay_ms = 10;
int count = 5;
int pin_server = 0;

int
busy_wait_us(uint64_t const wait_time_us)
{
    uint64_t current_time_ns = clock_gettime_mon_ns();
    uint64_t target_time_ns = current_time_ns + (1000 * wait_time_us);
    while (clock_gettime_mon_ns() < target_time_ns) {
        continue;
    }
    return 0;
}


int
client_thread(int * index_ptr)
{

    int index = *index_ptr;

    // Create a connection to the server channel
    int connection_id = ConnectAttach(ND_LOCAL_NODE, 0, channel_id, _NTO_SIDE_CHANNEL, 0);
    if (connection_id == -1) {
        printf("[CLIENT_%d] ConnectAttach() failed (errno=%d, %s)).\n", index, errno, strerror(errno));
        return 1;
    }

    //uint64_t const affinity = (uint64_t)0x01 << index;
    uint64_t const affinity = (uint64_t)UINT64_MAX;
    ThreadCtl(_NTO_TCTL_RUNMASK, (void *)affinity);


    char thd_name_str[256];
    snprintf(thd_name_str, sizeof(thd_name_str), "client%d", index);
    pthread_setname_np(pthread_self(), thd_name_str);
    pthread_setschedprio(pthread_self(), 15);


    usleep(100);

    for (int i=0; i<count; i++) {

        char snd_buffer[MAX_MSG_SIZE];
        char rcv_buffer[MAX_MSG_SIZE];

        // Write message to buffer
        snprintf(snd_buffer,MAX_MSG_SIZE,"This is message %d from cliend_%d",i, index);
        #ifdef DO_PRINT
        printf("[CLIENT_%d] Sending Message: \"%s\"\n", index, snd_buffer);
        #endif
        long rc = MsgSend( connection_id, (void *)&snd_buffer, strlen(snd_buffer), (void *)&rcv_buffer, MAX_MSG_SIZE );

        // Thread now blocked until response arrives.

        if (rc != -1) {
            #ifdef DO_PRINT
            printf("[CLIENT_%d] Received Response: \"%s\"\n", index, rcv_buffer);
            #endif
            #ifdef DO_TRACE
            trace_logf(0xF, "[CLIENT_%d] Received Response: \"%s\"\n", index, rcv_buffer);
            #endif
        } else {
            printf("[CLIENT_%d] MsgSend() failed (errno=%d, %s)).\n", index, errno, strerror(errno));
            return 1;
        }

        busy_wait_us(WORK_TIME_US);
    }

    return 0;
}

int
server_thread( int * index_ptr )
{

    int index = *index_ptr;

    char snd_buffer[MAX_MSG_SIZE];
    char rcv_buffer[MAX_MSG_SIZE];

    unsigned msg_count = 0;

    if (pin_server) {
        uint64_t const affinity = (uint64_t)0x01 << index;
        ThreadCtl(_NTO_TCTL_RUNMASK, (void *)affinity);
    } else {
        uint64_t const affinity = (uint64_t)UINT64_MAX;
        ThreadCtl(_NTO_TCTL_RUNMASK, (void *)affinity);
    }

    char thd_name_str[256];
    snprintf(thd_name_str, sizeof(thd_name_str), "server%d", index);
    pthread_setname_np(pthread_self(), thd_name_str);
    pthread_setschedprio(pthread_self(), 15);

    // Wait for messages.
    while(1) {

        int rc;
        int rcvid;

        // Wait to receive a message.
        rc  = MsgReceive( channel_id, (void *)rcv_buffer, MAX_MSG_SIZE, NULL);
        if (rc != 0) {
            rcvid = rc;
            #ifdef DO_PRINT
            printf("[SERVER_%d] Received Message(rcvid=%d): \"%s\"\n", index, rcvid, rcv_buffer);
            #endif
            #ifdef DO_TRACE
            trace_logf(0xF, "[SERVER_%d] Received Message(rcvid=%d): \"%s\"\n", index, rcvid, rcv_buffer);
            #endif
        } else {
            printf("[SERVER] MsgReceive() failed (errno=%d, %s)).\n", errno, strerror(errno));
            return 1;
        }

        busy_wait_us(WORK_TIME_US);

        // Send a Reply
        snprintf(snd_buffer,MAX_MSG_SIZE,"This is response %d", msg_count++);
        #ifdef DO_PRINT
        printf("[SERVER_%d] Sending Response: \"%s\"\n", index, snd_buffer);
        #endif
        rc = MsgReply( rcvid, 0, (void *)snd_buffer, strlen(snd_buffer));
        if (rc == -1) {
            printf("[SERVER_%d] MsgReply() failed (errno=%d, %s)).\n", index, errno, strerror(errno));
            return 1;
        }
    }
}

int
main(const int argc, char ** argv)
{
    int c;
    while ((c = getopt (argc, argv, "s:c:n:d:p")) != -1) {
        switch (c) {
            case 's':
                server_threads = strtoul(optarg, NULL,10);
                break;
            case 'p':
                pin_server = 1;
                break;
            case 'c':
                client_threads = strtoul(optarg, NULL,10);
                break;
            case 'n':
                count = strtoul(optarg, NULL,10);;
                break;
            case 'd':
                delay_ms = strtoul(optarg, NULL,10);
                break;
            case '?':
                fprintf(stderr, "Unknown option\n");
                return 1;
            default:
                break;
        }
    }

    pthread_setname_np(pthread_self(), "main");
    pthread_setschedprio(pthread_self(), 20);

    channel_id = ChannelCreate(_NTO_CHF_UNBLOCK);
    if (channel_id == -1) {
        printf("ChannelCreate() failed (errno=%d, %s)).\n", errno, strerror(errno));
        return 1;
    }

    int rc;

    // Create the server thread
    pthread_t server_thd[MAX_THREADS];
    for (int i=0; i<server_threads; i++) {
        rc = pthread_create( &server_thd[i], NULL, (void *)server_thread, &i);
        if (rc != 0) {
            printf("pthread_create() failed (errno=%d, %s)).\n", errno, strerror(errno));
            return 1;
        }
    }


    // Create the client threads
    pthread_t client_thd[MAX_THREADS];
    for (int i=0; i<client_threads; i++) {
        rc = pthread_create( &client_thd[i], NULL, (void *)client_thread, &i);
        if (rc != 0) {
            printf("pthread_create() failed (errno=%d, %s)).\n", errno, strerror(errno));
            return 1;
        }
    }

    #ifdef DO_TRACE
    TraceEvent(_NTO_TRACE_START);
    #endif

    // Wait for client thread to execute
    for (int i=0; i<client_threads; i++) {
        pthread_join(client_thd[i], NULL);
    }

    #ifdef DO_TRACE
    TraceEvent(_NTO_TRACE_STOP);
    #endif

    return 0;
}