Condition Statistics
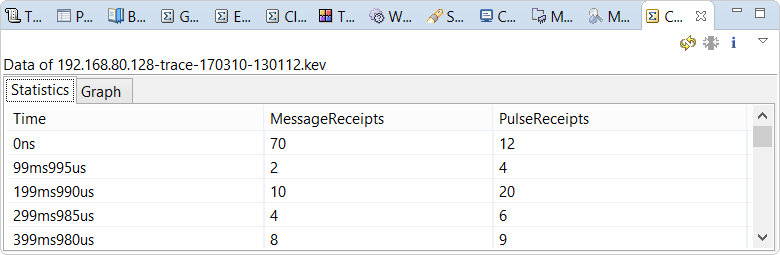
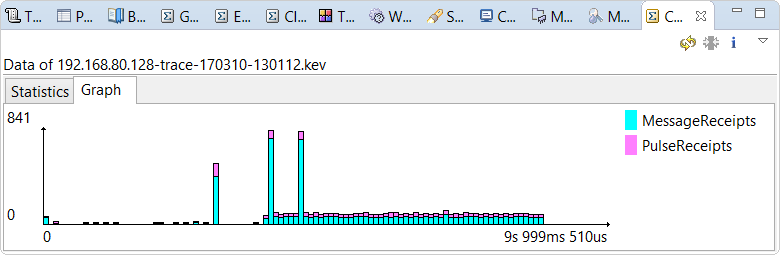
This view lets you see the statistical distribution over time of events matching certain conditions. The results include a table displaying the precise number of matching events at exact times during the trace as well as a bar graph illustrating how the number of events changed over time.
The conditions that you can use to gather event statistics are the same as those defined for the Timeline search feature. The Condition Statistics view lets you select any combination of these conditions.
- Configure Table — opens a window for picking the conditions that events must match to be counted in the table statistics
- Configure Conditions — opens a window that lists all defined conditions and lets you add, remove, and edit them; this is similar to the bottom part of the Trace Search tab.
You can click the second button and modify the conditions to suit your event-matching criteria. To generate statistics,
click the first button, check the boxes (in the Condition Selection window) for all conditions that
you want the event data to be based on, then click OK.
The IDE then prompts you to rerun the statistics gathering. In fact, you can manually update the
table data any time after you've selected new matching conditions, by clicking Gather statistics.
For convenience, the view toolbar has a Configure Table button
(![]() ).
).
The view offers the two common
statistics features of toggling between global and selection-based statistics and generating CSV reports;
both features are accessible in the upper right dropdown
(![]() ).
The dropdown also has the Configure Table and Configure Conditions options,
as well as Set number of divisions, which lets you specify the number of statistical samples.
This setting therefore determines how many rows are seen in the Statistics tab and how many bars
are drawn in the Graph tab.
).
The dropdown also has the Configure Table and Configure Conditions options,
as well as Set number of divisions, which lets you specify the number of statistical samples.
This setting therefore determines how many rows are seen in the Statistics tab and how many bars
are drawn in the Graph tab.
The higher the number of divisions, the smaller the intervals used for generating statistics. For instance, if the trace lasted exactly ten seconds and you use the default of 100 divisions, the samples reflect the number of matching events in 10 / 100 = 0.1 second-intervals. But you could increase this to 1000 divisions if you wanted to use 0.01 second-intervals.