Malloc Information
You can examine a process's heap through the Malloc Information view. This view illustrates heap usage and provides statistics such as allocation call counts and block counts for specific byte ranges.
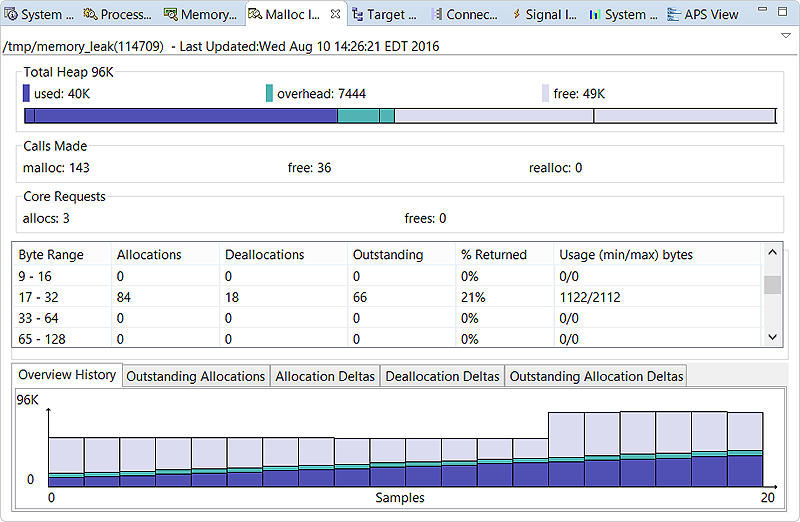
- The screenshot above represents a system targeting SDP 7.1. In an SDP 8.0 target, there's less data available. Continue reading below to understand what's changed.
- All three panes—Overview, Distribution, and Charts—are shown by default but you can hide any of them by deselecting the corresponding options in the dropdown in the upper right corner.
Overview
This top pane provides statistics about activity for the entire heap, in multiple panels.
Total Allocator Managed Memory
- Used (purple)
- Free (lavender)
This bar graph quickly tells you whether the process is running low on heap space. You can hover the pointer over a section to see a tooltip stating the purpose and size of the corresponding memory area (e.g., used space for small blocks, overhead for metadata of large blocks).
The total heap size is displayed next to the title. Here, the numbers shown are exact measurements that come from the allocation library, unlike with the Memory Information and System Resources views, which display estimates.
Calls Made
The numbers of malloc() and free() calls made by the process are given in this panel. The number of realloc() calls isn't available in an SDP 8.0 target.
Core Requests
This panel doesn't show statistics in an SDP 8.0 target.
Distribution
This pane doesn't show statistics in an SDP 8.0 target.
Charts
This bottom pane only displays data for the Overview History, which represents a timeline of the heap usage snapshots shown in the Total Allocator Managed Memory panel. This bar graph automatically rescales as the process increases its total heap size.