Debugging an application
You can run a program with the debugger by using either a command or a launch configuration file.
Debugging a program using a command
You can debug a program using a QNX command.
To debug the application:
- From the workspace, right-click the program's project folder.
- Navigate to QNX > Debug as QNX Application.
- Click Debug as QNX Application.
- Select the launch configuration for debugging. The QNX Toolkit runs and debugs the program.
Debugging an application using the launch configuration
You can use the launch configurations to specify detailed debugging behavior.
Creating the debugging launch configuration:
You configure the debugging session by editing the launch.json file.
To edit the file:
- From the workspace of the project, click the launch.json file.
- Use Add Configuration to add detailed settings.
To see the configuration options for the debugger, go to launching an application.
Attaching to a process with the debugger
To attach to a process with the debugger:
- From QNX TARGETS, expand the PROCESSES folder.
- Right-click on a process on the target.
- Click Attach Debugger to QNX Process.
- The debugger attaches to the process. The IDE attaches the debugger to the process and stops execution immediately. The Debug view displays information about the active threads and their stack frames.
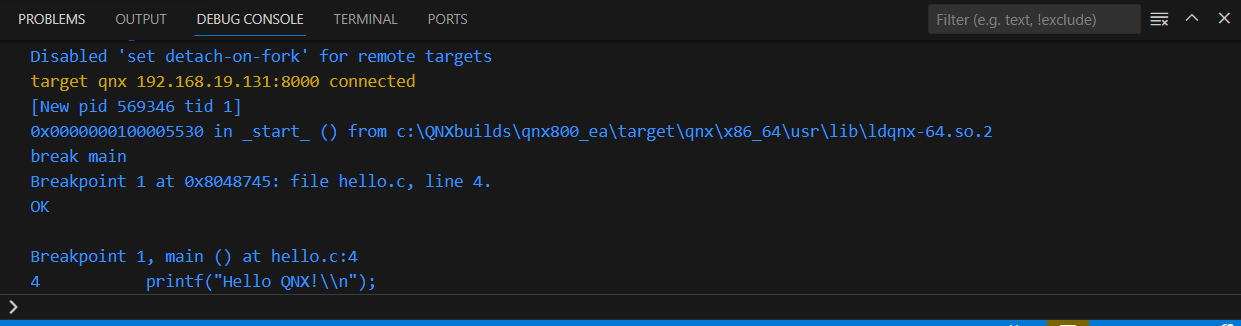
Using the debugger console
You can use the debugger console to view information about the debugging process. You can also use it to enter GDB commands.
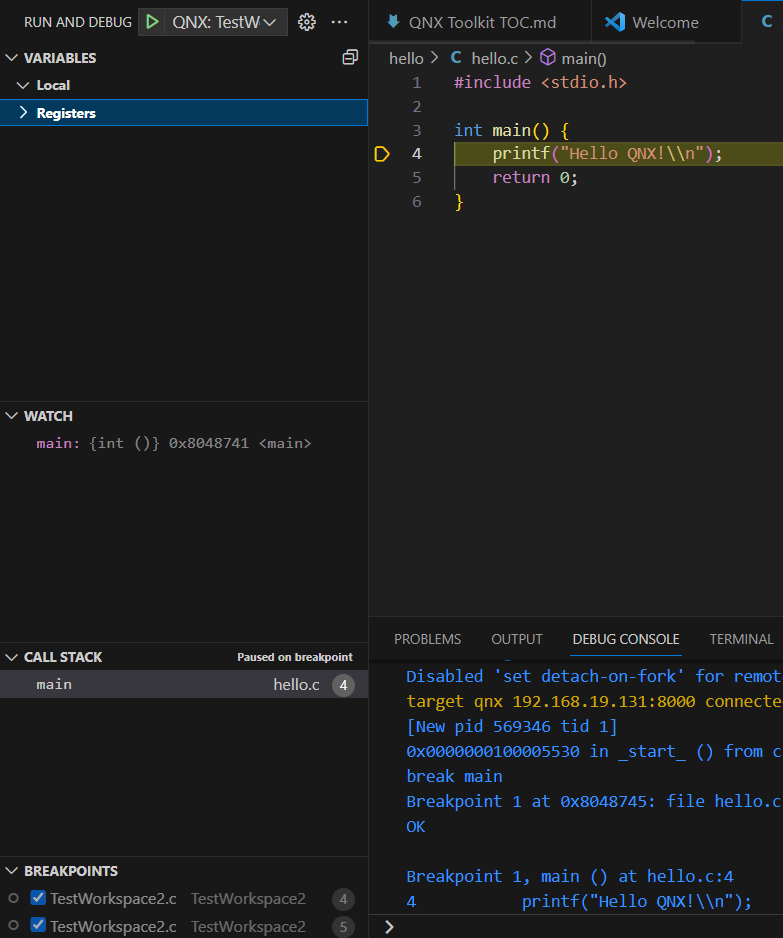
Using debugger views
You can use the debugger views to help you with the debugging process. For example, examining call stacks is useful for seeing when an application's functions were executed relative to other system events. When you step through your code, the QNX Toolkit populates the Call Stack view with the call sequences that were active. You can double-click a call stack entry to open the associated source file at the corresponding line of code.
| Column | Description |
|---|---|
| Variables | View local variables and registers. |
| Watch | Add watchpoints that dynamically update as you step through the code. |
| Call Stack | Examine the thread call stacks for a particular time point in the code. |
| Breakpoints | Add breakpoints by double-clicking on individual lines of code. |
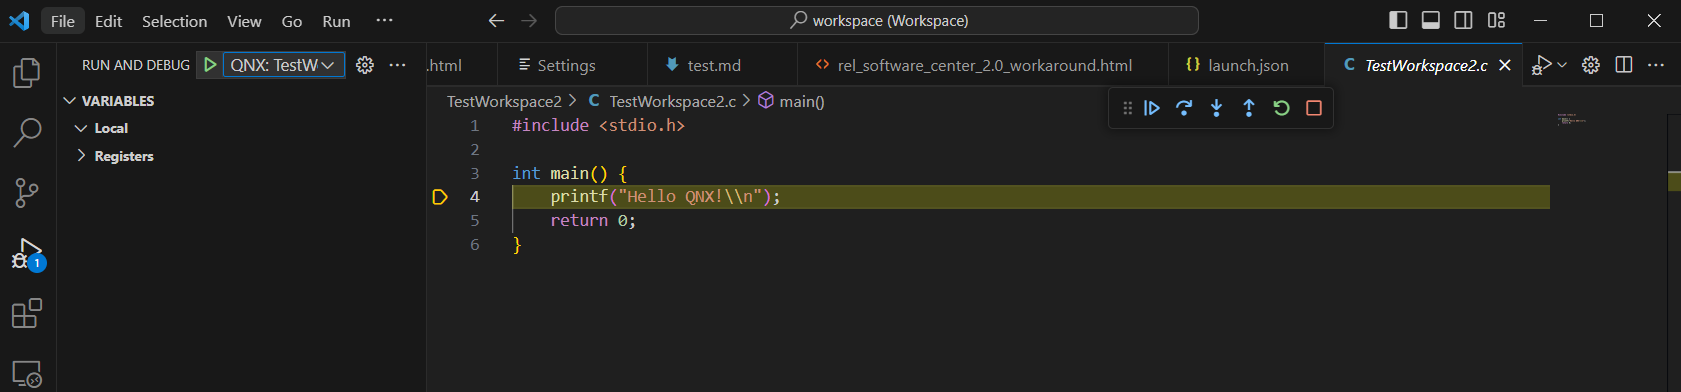
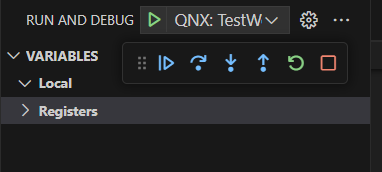
Run and debug controls
You can use the Run and Debug controls to help you with the debugging process.
- Start (
 ) — resume execution of the currently suspended program
- Continue (
 ) — continue debugging
 - Step Over (
 ) — execute the current line and stop at the next line
 - Step Into (
 ) — execute the current line, including code inside of any
routines, and proceed to the next statement
) — execute the current line, including code inside of any
routines, and proceed to the next statement - Step Out (
 ) — step out
 - Restart (
 ) — restart execution of the code