Analyzing cache usage with Valgrind Cachegrind
Valgrind Cachegrind simulates cache memory and measures a program's reads and writes and its misses at various cache levels. It also reports branch misprediction rates. Cachegrind writes these statistics into the analysis results, which the IDE then parses to display performance data.
- In the launch bar, expand the Launch Configuration dropdown (which is in the middle) and select the project for which you want to analyze cache usage.
- In the Launch Target dropdown (on the right), select the target for running your application.
- In the Launch Mode dropdown (on the left), select Memory.
-
Click the Edit button (
 )
on the right of the Launch Configuration dropdown.
)
on the right of the Launch Configuration dropdown.
- In the configuration editor window, access the Valgrind controls by clicking the Memory tab on the right and then the Valgrind radio button near the top of this tab.
- Select Cachegrind from the Tool to run dropdown.
- Optional:
You can change any settings to customize what gets reported in the Valgrind results.
The Cachegrind tab lets you enable and disable the collection of certain statistics and set the properties of the simulated caches.
- Click OK to save the configuration changes and close the window.
-
In the launch bar, click the Memory button
(
 ).
).
The IDE switches to the QNX Analysis perspective. If necessary, the IDE first builds the binary before uploading it to the target. To analyze the application, the IDE instructs Valgrind to execute the uploaded binary with Cachegrind instrumentation. Then, it creates a session for storing the Valgrind results; this new session is displayed in the Analysis Sessions view. When the program terminates, Valgrind writes the results to a log file, which the IDE copies into the directory area for the new session.
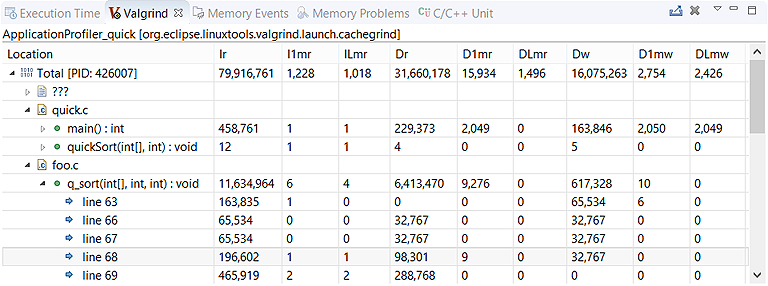
Double-clicking any function row opens the source code to the corresponding line.