Memory Information
The Memory Information view gives an overview about the memory allocation pattern for a process. Specifically, it displays a memory distribution map and information about each segment.
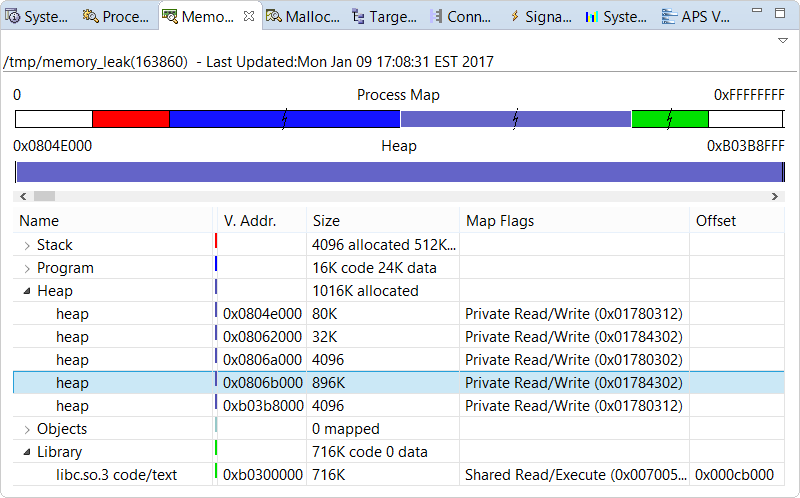
- Stack (red) — light red for the guard page, medium red for unallocated memory, dark red for allocated memory
- Program (blue) — dark blue for code (text), light blue for data
- Heap (purple) — purple for all regions, including guard pages
- Objects (cyan) — cyan for shared heap objects with certain memory flags
- Library (green) — dark green for code, light green for data
Just below, another bar shows the breakdown of the segment selected in the table further below. This second bar graph also uses color shade variations for different segment regions (e.g., guard pages versus allocated memory). Note that it's not scaled, meaning no compression of large areas is done. To navigate the entire bar display, use the scrollbar underneath. Here, the numbers in the corners indicate the virtual address range of the segment.
- Name
- Descriptive name of the segment
- Virtual Address
- Virtual start address of the segment
- Size
- Size of the segment. For major categories, this column lists the totals for the minor categories.
- Map Flags
- Flags and protection bits enabled for the segment. For more information, see the flags and prot arguments for the mmap() function.
- Offset
- The segment's offset into shared memory, which is equal to the off argument for mmap().
When you click a table row, the corresponding segment is outlined in both bar graphs at the top. By default, the segments are categorized by type, but you can display them in a flat list by deselecting Categorize in the dropdown in the upper right corner of the view. There's also an option for copying the table contents to the clipboard, so you can take a snapshot of memory distribution details.
How memory types relate to virtual memory categories
| VM category | Memory type | Notes |
|---|---|---|
| Code | Program | |
| Shared Code | Library | Each shared library has its own code segment (and hence, table entry). |
| Data | Program | |
| Stack | Stack | Each thread in the application and shared library code has its own stack. |
| Heap | Heap | All heap segments for the application and shared libraries. |
| Shared Heap | Objects |