Monitoring memory consumption at the process level
The QNX System Information perspective contains multiple views that show memory usage data about target processes. These data let you compare the memory footprint of different processes, see the distribution of memory in different segments, and observe changes in a process's heap usage.
These activities are often the first steps in optimizing an application's memory usage because the data values shown in the IDE tell you which segments (e.g., stack, heap) are too big or growing too quickly.
Comparing memory segment sizes of target processes
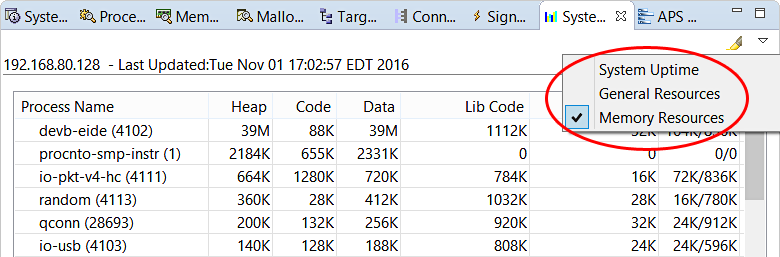
The view then displays the heap, code, and data segment size for each process.
You can sort the process list based on any metric, by clicking the corresponding column header,
and highlight any changed values by clicking the highlight button in the upper right toolbar
(![]() );
further details are given in the System Resources reference.
);
further details are given in the System Resources reference.
Examining memory distribution for a process
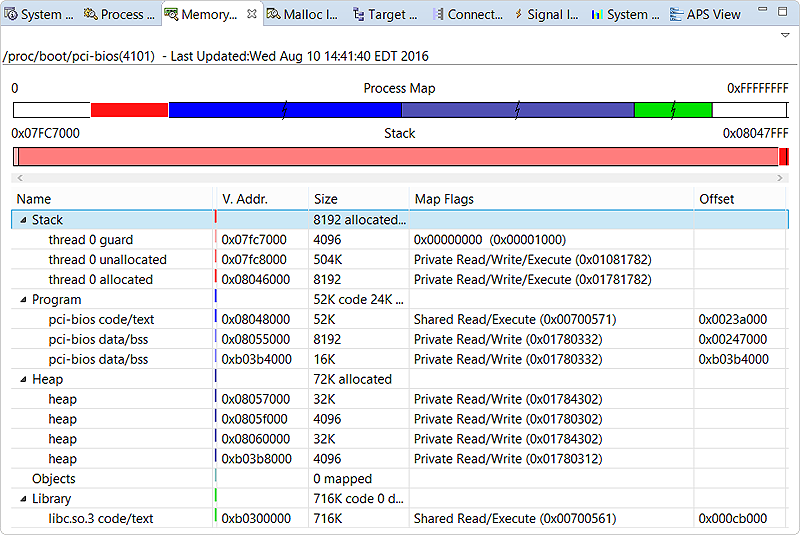
The Process Map bar at the top shows the breakdown of process memory based on type (e.g., Stack, Program, Heap). The memory types are color-coded, with large areas compressed and marked with a jagged line. The numbers in the top left and right corners represent the process's start and end addresses in virtual memory.
Just below is another bar, which shows the breakdown of the memory segment selected in the table further below. Initially, the segment representing the entire stack is selected. Here, the numbers in the corners indicate the virtual address range of the segment.
The table lists the name, virtual address, size, map flags, and offset (when applicable) for each memory segment. Details about these fields are given in the Memory Information reference. The table selection is reflected in both bar graphs at the top.
Monitoring heap memory consumption
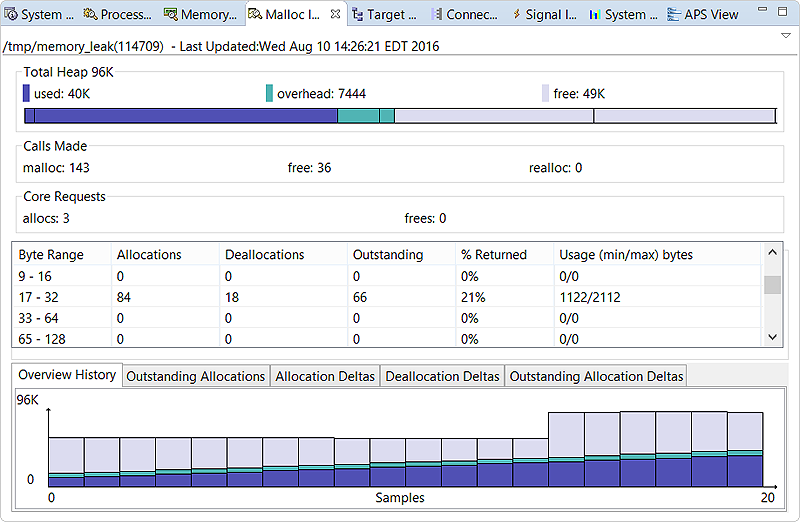
In the table that lists allocation counts, you can watch the Outstanding column to see if the program is allocating memory in a certain size range faster than freeing it, which can degrade performance. To observe changes in the overall heap usage, you can examine the Overview History graph. In this example, the program's used section of the heap is growing steadily, causing the overall heap size to increase as well. You would then want to look for memory leaks.
Full details on all statistics shown in this view are given in the Malloc Information reference.