QNX Momentics Tool Suite
The QNX® Momentics® Tool Suite is a comprehensive, Eclipse-based integrated development environment with innovative profiling tools for maximum insight into system behavior. These unique tools give developers at-a-glance views of realtime interactions, memory profiles, and more, enabling shorter debug times and faster time to market. Multi-core specific tools help developers migrate code cleanly from single-core to multi-core systems, and safely optimize performance.
Features
- Based on open Eclipse IDE
- Supports C and C++
- Multi-core support
- Integrated source control
- Source debugger
- System builder
- Target system information
- Application profiler
- System profiler
- Memory analysis
Development hosts
- Windows
- Linux
Target processors
- ARM
- x86
Libraries and GNU tools
- ANSI C
- C++11
- Dinkum C++11 and embedded C++
- GCC optimizing compilers
Documentation and training
- Online manuals
- Printed documentation
- Tutorials
- Cheat sheets
- Example projects
Recommended system requirements
- 2 GHz Intel Pentium 4
- 2 GB RAM
- 4 GB disk space
- 1280 x 1024 monitor resolution
These system requirements are recommended for a Microsoft Windows or Linux host.
The QNX® Momentics® Tool Suite offers all the development and debugging features commonly found in other Eclipse-based IDEs, plus unique QNX capabilities, such as multi-core profiling and an instrumented kernel.
One IDE
Eclipse provides well-defined interfaces to ensure that tools work together seamlessly. All tools share the same look and feel, so developers only need to learn one user interface.
Developers also benefit from an open, extensible platform for tool integration supported by a large and rapidly growing community of tool vendors and developers. They can plug in third-party tools, or build their own plug-ins using the industry-standard Eclipse framework.
Rapid development
The QNX Momentics Tool Suite provides productivity and quality analysis tools that accelerate all phases of product delivery, such as:
- Wizards for quickly and easily creating projects
- A system builder for generating target images with pre-built files
- A code coverage tool for highlighting exercised source code paths for speedier and more thorough quality assurance
Performance optimization
The QNX Momentics Tool Suite’s unique tool set facilitates not only debugging but also performance optimization. Tools such as the system profiler and application profiler let developers pinpoint where — in both single-core and multi-core systems — optimizations will most improve performance, while tools such as the code coverage tool and mudflap provide everything necessary for building the most robust and reliable embedded systems possible.
Design flexibility
The QNX Momentics Tool Suite lets development teams determine the best target platform for a project, and the host and programming language that best suits their skills and preferences. It supports:
- C and C++ programming languages
- Windows or Linux hosts
- ARM, and x86 targets
The QNX Momentics Tool Suite even offers the flexibility to work with a mix of languages and processor architectures simultaneously.
The QNX® Momentics® Tool Suite provides an optimized environment for C and C++ development. Developers can work in either a command-line or a graphical IDE environment, and take advantage of many productivity features, such as wizards, code editors, and flexible makefile structures.
Wizards
The QNX Momentics Tool Suite includes built-in project wizards to automate the entire project-creation process. Developers can:
- Choose between C, C++, makefile, and QNX projects
- Create a project for any combination of target processors with a guide through the steps
- Populate the project with build directories, dependency files, and starting source code
- Automatically compile the entire project to create a working application
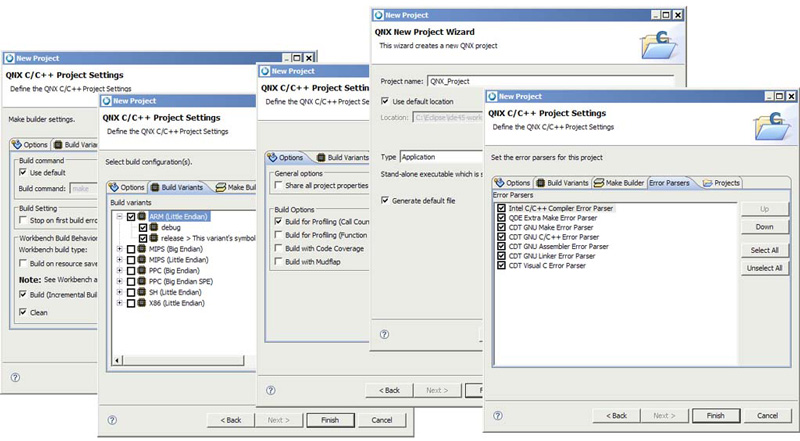
Built-in project wizards automate the entire project-creation process.
The QNX Momentics Tool Suite code editors offer a large set of user-defined preferences and the most useful time-saving features, including cut-and-paste, undo, commenting, highlighting, and language-specific indentation.
The IDE uses both embedded and external editors. When a user opens a file, the IDE launches the embedded editor associated with that file. If no embedded editor is available, the IDE attempts to launch an appropriate external editor.
Content assist
Using editors, developers can implement a content-assist feature that offers function-name suggestion and completion, display of function synopses, arguments, and required headers, and insertion of all required "include" statements.
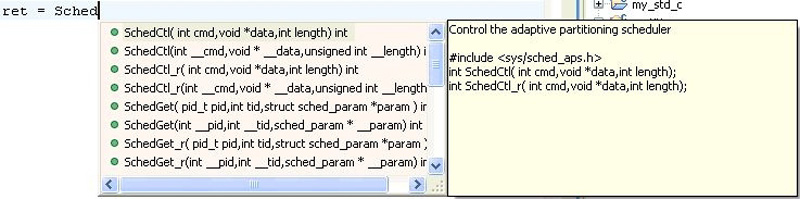
The content assist feature suggests and completes function names, and displays synopses, arguments, and required headers.
Code folding
Developers can fold (hide) sections of code they are not working on. This folding includes mixed folding, which lets users designate code subsections that will remain visible even when their parent section is folded.
Code templates
Using a single keystroke, developers can insert commonly used code constructs, such as exception-handling blocks or "for" loops. Each editor comes with predefined templates that can be edited or cloned.
Markers
Editors display markers associated with the current file, including breaks and errors generated by the build tools. A simple click on the marker indicates the offending line. Developers can also insert markers to serve as task reminders or bookmarks.
Source navigator
The source navigator supports context-specific searches for references and definitions, outline views for fast navigation of source code and project header files, and jumps to functional declarations and prototypes.
Local history
The IDE editors maintain local history that facilitates temporary debugging changes. Developers can set editor preferences to automatically keep multiple revisions of working files, compare versions, merge versions, and undo changes.
The IDE lets developers use the build tools they prefer for embedded system development. They can build exactly the same binaries and context with:
- Command-line tools invoked from inside the IDE
- IDE tools
- Command-line and IDE tools
Build settings control
The IDE allows developers to configure build settings such as compiler and linker options, extra includes, and libraries.
Multiprocessor makefiles
The IDE eliminates the need to handcraft makefiles for multiprocessor environments. A point-and-click interface lets developers build what they need for the environment, including targeting one or more CPUs and building multiprocessor, recursive makefile frameworks. The IDE saves the build settings in a conventional makefile format.
Reuse and port
Developers can reuse existing projects based on makefiles or port projects based on a build command other than make.
Launch configuration wizard
Developers can build, run, and debug with a single click. Using the launch configuration wizard, they can also quickly specify programs to launch, targets to use, and debug options.
The IDE supports launch groups that allow multiple applications to be downloaded and launched at the same time, or in a user-determined sequence. The IDE remembers launch group preferences, so launching subsequent sessions are quick and easy.
With the IDE, developers can manage all source code in just one environment. The IDE supports:
- Git support for distributed version control management via the EGit Eclipse plug-in
- Subversion for seamless integration with Subversion-based repositories such as Foundry27
- CVS source-control protocol with support for both remote pserver and secure SSH repository access
- Many other configuration management systems through Eclipse plugins: ClearCase, Perforce, SCWI, etc.
Built-in version and configuration management
Version and configuration management are built right into the IDE framework so there is no need to switch out of the IDE to manage source code. Developers can work in a heterogeneous source-control environment using different source-control protocols for different projects — even for different files in a project.
Version control, comparison, and merging
Key IDE source control features include:
- Version control when updating source base
- Version control when releasing changes to team members
- Revision history when browsing files to view changes others have made
- Graphical file version comparison
- Interactive merge capabilities to resolve conflicts from multiple developers modifying the same source
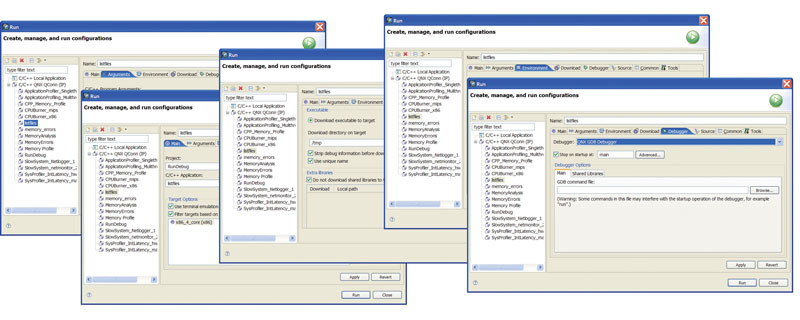
The configuration wizard lets developers quickly specify programs to launch, targets to use, and debug options.
The QNX® Momentics® Tool Suite includes a unified debugging environment that is completely integrated with the other tools in the suite. It offers developers the flexibility to best address the problems at hand regardless of programming language.
Views from any of the other tools can be opened directly in the source debugger to provide complete application state and data information. Other capabilities of the source debugger allow developers to:
- Concurrently debug multiple applications coded in C and C++
- Debug multi-threaded applications with independent tracking for each thread and trace control from thread to thread
- Debug multiple processes distributed across multiple CPUs (or cores in a multi-core processor) and trace execution paths from one CPU to another
- Dynamically attach the debugger to any running process
- Perform postmortem analysis of core dump files
The QNX® Neutrino® RTOS includes an instrumented version of the microkernel with a sophisticated tracing and profiling mechanism for realtime execution monitoring on both single processor and multiprocessor systems. Working in the IDE, developers can configure all trace events and modes, then transfer log files automatically to a remote system for analysis.
High performance
The instrumented kernel uses very little overhead and gives exceptionally good performance. It requires only about 30 kilobytes of additional memory, and is typically about 98% as fast as the non-instrumented kernel when it isn't logging.
Thanks to this low overhead and high performance, many users choose not only to use the instrumented kernel during project development and prototyping, but also to deploy it in the final product — greatly improving their systems’ post-delivery diagnostic and debugging capabilities.
Non-intrusive
The instrumented module is non-intrusive — there's no need to modify a program's source code in order to monitor how that program interacts with the kernel.
Event control
Developers can use the QNX® Momentics® Tool Suite to easily limit the amount of data recorded and delivered by the instrumented kernel in order to focus on the data they need to solve specific issues, including:
- Controlling the initial conditions that trigger trace event deliveries
- Applying predefined kernel filters to dynamically control trace event deliveries
- Implementing custom trace event handlers to further filter the data that is recorded and delivered
With the QNX® Momentics® Tool Suite application profiler, developers can examine the overall performance of programs, no matter how large or complex, without following the source one line at a time. They can quickly target areas of highly used code for debugging, performance analysis, and optimization.
- Gather live profiling by attaching the profiler to software already running on the target
- Drill down to source-line level to show which lines consume the most CPU cycles
- Analyze processor usage for multiple processes and targets, as well as for shared libraries
- Capture complete execution information by compiling and launching a fully profiled version of the software on the target
- Perform post-mortem profiling and analysis by loading statistical files into the profiler
Non-intrusive profiling
The application profiler samples execution at regular intervals to help developers pinpoint inefficiencies in applications and shared libraries. This method requires no instrumentation, code changes, or special compilation, and ensures that the profiler doesn’t contaminate the information it collects. The application profiler does not require instrumentation and has low overhead. Sampling can be reset without restarting applications, so developers can easily compare results under different loads.
Instrumented profiling
To obtain exact execution counts, the compiler can instrument the compiled code for profiling by the application profiler. This code reports function calls and call-pair (caller-called) information. Once call counts and execution statistics have been used to pinpoint bottlenecks, developers can use the IDE’s navigable call graph to find the callers and ancestors of a function — great for identifying where best to optimize code.
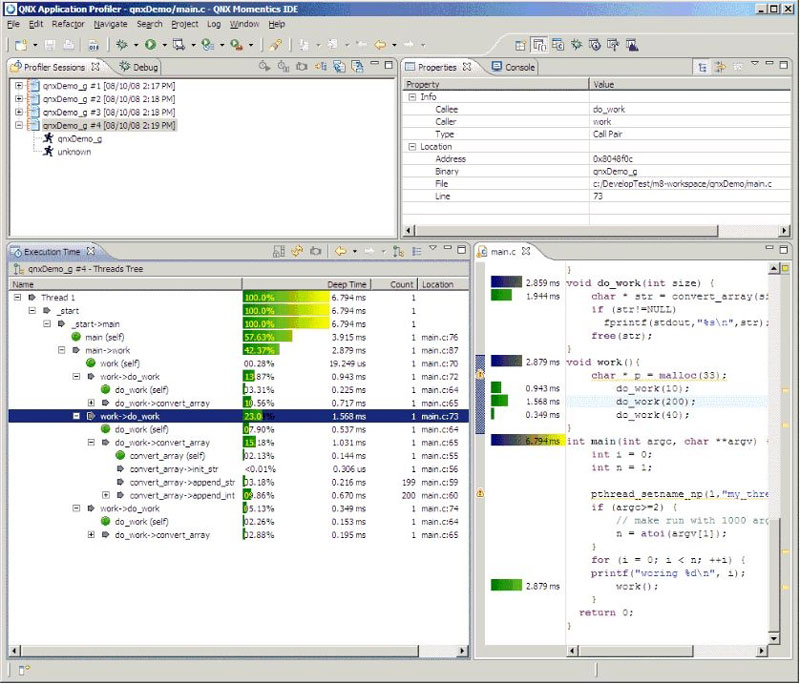
The application profiler helps developers quickly answer the question: "Where can I optimize?"
Multi-core optimization
After an initial port to a multi-core system, developers can use application-profile analysis to rapidly isolate code for parallel execution. For example, a CPU-intensive signal processing routine will stand out in an application profile; breaking this routine into several multi-threaded routines will permit parallel execution in a synchronous multiprocessing (SMP) system.
The QNX® Momentics® Tool Suite system profiler works in concert with the instrumented kernel to provide insight into the operating system's events and activities. Like the application profiler, the system profiler can help pinpoint areas that need improvement at a system-wide level:
- IPC bottlenecks — by observing the flow of messages among threads
- Resource contention — by watching threads as they change states
- Cache coherency in a multi-core machine — by watching threads as they migrate from one CPU or core to another
Multi-core system profiling
The system profiler works on both single-core systems and multi-core systems implementing symmetric multiprocessing (SMP). Multi-core system profiling features, for the entire system or for individual CPUs, include:
- Thread color coding by CPU for easy identification of which processor every thread runs on
- CPU migration summary to show how much kernel scheduling moves a thread between processors and to help pinpoint causes of cache thrashing
- Inter-core messaging summary to show how much message passing occurs between cores
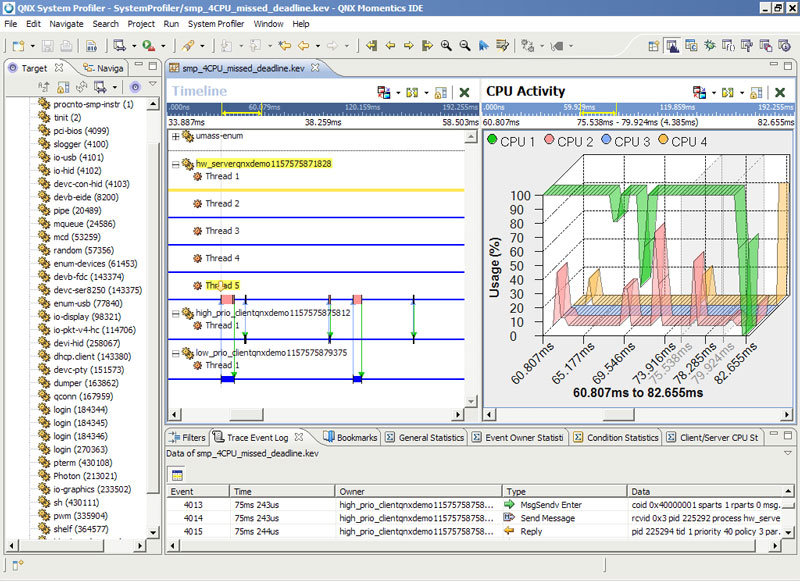
The system profiler works with the instrumented kernel to help pinpoint areas for optimization.
Snapshots, summaries, statistics, and more
The system profiler gives developers the tools they need to understand exactly what their system is doing, and how they can resolve problems and fine-tune for performance:
- A graphical display uses data from the instrumented kernel to show component interactions
- Thread state snapshots provide summaries of the state of every thread at specified times
- A "why running" tool lists the events that lead to the current state of a thread
- User-defined filters focus tracing on events of particular interest, reducing the volume of data to simplify analysis
- Client-server statistics include the amount of time a client needs directly, and the time it needs from the servers it uses
- Export traces to the application profiler show performance analysis of critical system interactions
The QNX® Momentics® Tool Suite includes an integrated code coverage tool that developers can use to identify code that did not run during testing. It also allows them to either modify the test suite to run the code or remove the code if no longer needed. The code coverage tool is ideal for:
- Launching a code coverage session to immediately monitor an application
- Viewing live results of binary coverage right down to the basic block (branch path)
- Launching a code editor to see at a glance which source lines have been, or have not been, covered
- Using all the navigation and referencing tools to help analyze code coverage data
- Viewing the progression of code coverage over several application runs
- Generating reports for additional analysis
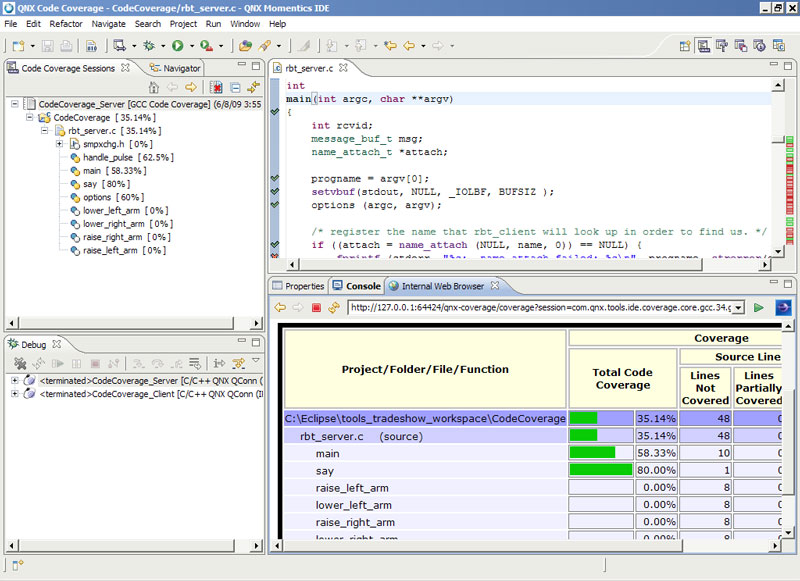
The code coverage tool is invaluable for stringent and complete testing, and produces report-ready results.
Code coverage is an essential tool for project environments that require stringent and complete testing. It can also be useful when bug fixing and software maintenance are handled by separate teams who may not be involved in the original code development, and who may even be located in different parts of the world.
The QNX® Momentics® Tool Suite offers a complete toolset for transferring boot images and files to target hardware, and for gathering important information from the target for diagnosis and debugging.
The system builder simplifies the building of OS images for embedded systems, saving developers countless hours when they create boot images for RAM, and custom Flash file system images. For every image created, the system builder:
- Supports the creation of new target image projects
- Lets developers import a pre-built target file from a BSP or other target image
- Enables migration of existing system builder projects from previous versions of QNX Momentics Tool Suite
Loading an image to a target
To transfer a build image to a target, the system builder can either use its built-in serial terminal, which can talk to remote ROM monitors, or transfer the image via TFTP or BOOTP.
After the target is up and running, developers can use any number of mechanisms for additional development and file transfers. They can, for instance, use the IDE’s file browser to directly edit and update files on the target.
The QNX Momentics Tool Suite includes a unique, extensible target-agent architecture that supports multiple target tool service interactions, such as launching, debugging, profiling, and information gathering.
The target agent enables any tool in the IDE to communicate with the target. When the host system activates a service, the target agent loads a corresponding module on the target. When the service is no longer required, the target agent removes the service, keeping the target’s footprint to only what is required.
Like any QNX driver, the target agent can be dynamically started and stopped as needed.
The IDE includes a target filesystem navigator, which provides a consistent view of target systems. Developers can use the target navigator to perform numerous tasks:
- Define targets and connect to them
- Associate a default project, such as a system image, with a specific target system
- Determine the accessibility of all target boards and devices
- Choose a specific target for an action, such as launching Telnet session
- Show information for connection, malloc, memory, process, and signal information views
New tools can use the target filesystem navigator as an extension point to add their own actions to the target system context menu. Such actions may include generating a signal for a process on the target system, or attaching the debugger to a running process.
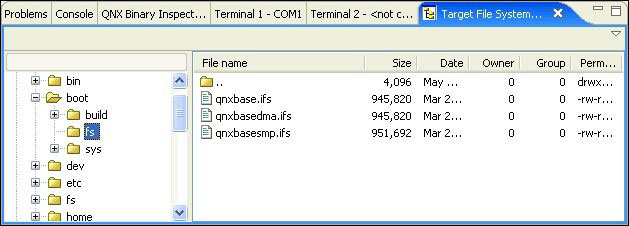
The target navigator lets developers drag and drop files to and from the target .
The IDE includes a target system information tool that provides a wealth of live and post-mortem information from the target system:
- Detects points of high resource use — memory consumption, CPU utilization, and number of file connections
- Helps detect and resolve potential deadlock situations — presents a graphical representation of the blocking relationships among processes
- Manipulates files on a remote target system as if they were residing on a local host
- Transfers new files to a remote target, where they can be edited directly from the IDE
- Extends the program launcher, allowing developers to launch executables on the target with a simple double-click
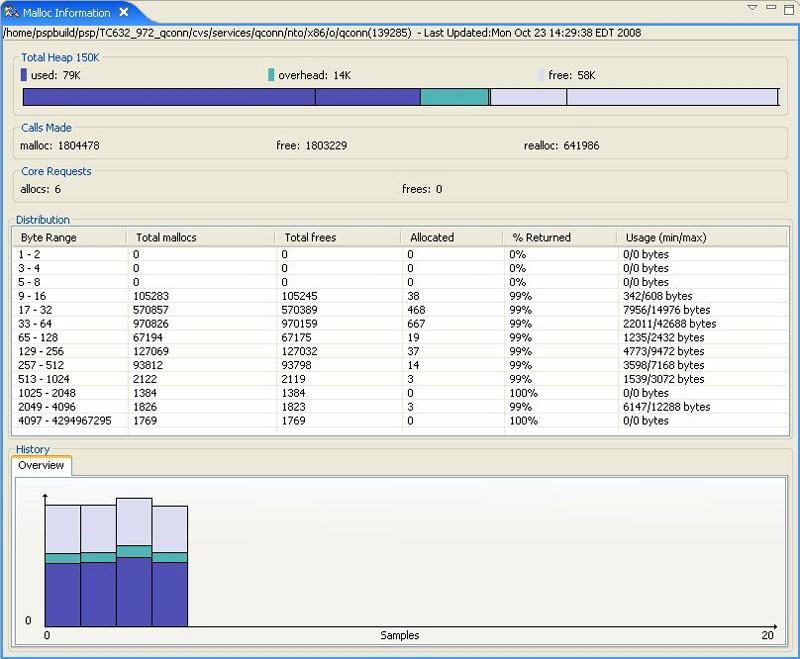
The QNX target system information tool provides developers with high-level and detailed information about target systems, right down to thread attributes.
Overview and drill-down information
The target system information tool offers developers high-level overviews of an entire target system, and detailed information about processes and threads. For example, developers can start with a high-level overview to determine which processes are active and identify the arguments being used for them. They can then view CPU and memory usage, both for the system and per process. Finally, they can drill down as needed to examine thread attributes (state, scheduling policy, CPU usage, stack size) signal states, program memory maps and file descriptors.
The QNX Momentics Tool Suite continues to evolve. The last release (4.7) became generally available with the release of the QNX Software Development Platform 6.6.0.
Release 5.01
- Eclipse 4.2 and CDT 8.1.2
- GNU C/C++ compiler 4.73 and GBD 7.5
- Codan C/C++ Static Analysis in CDT
- Git Distributed Version Control
- New System Builder
Release 4.7
- Eclipse 3.5.2 and CDT 6.0 integration
- GNU C/C++ compiler 4.4 and GDB 6.7 support
- Support for lazy linking and loading
Release 4.6
- Eclipse 3.4 and CDT 5.0.2 integration
- GNU C/C++ compiler Mudflap visualization
- Foundry27 integration and BSP imports — direct BSP checkouts through the IDE
- System profiler improvements
Release 4.5
- Eclipse 3.3 and CDT 4.0 integration
- C/C++ development environment enhancements
- Target system information tool improvements
- Application profiler and system profiler improvements
- GNU C/C++ compiler 4.2 code coverage support