Analyzing heap memory usage with Application Profiler
An application can be instrumented to measure and report its heap size at every function entry and exit. The Application Profiler can then calculate each function's heap size changes and provide a detailed breakdown of heap memory usage.
To profile functions, your source files must be compiled with -finstrument-functions
and your binaries linked with -lprofilingS; for details, see
Enabling function instrumentation
.
- In the launch bar, expand the Launch Configuration dropdown (which is in the middle) and select the project for which you want to analyze heap usage.
- In the Launch Target dropdown (on the right), select the target for running your application.
- In the Launch Mode dropdown (on the left), select Profile.
-
Click the Edit button (
 ) on the right of the Launch Configuration dropdown.
- In the configuration editor window, click the Profile tab on the right and the Application Profiler radio button near the top of this tab.
- Ensure that Functions Instrumentation is selected under Profiling Method and Single Application is selected under Profiling Scope.
- In the Profiling Counter dropdown, select Memory: Allocated Heap.
- Optional:
You can adjust other profiling settings through the Options and
Control panels.
For details about these fields, see the Application Profiler reference.
- Click OK to save the configuration changes and close the window.
-
In the launch bar, click the Profile button
(
 ).
).
The IDE switches to the QNX Analysis perspective. If necessary, the IDE first builds the binary. Then, it uploads the binary and starts running it on the target. At this time, a new session is created and displayed in the Analysis Sessions view. As the application runs, profiling results are sent to the IDE, which stores them in the new session and presents them in the Execution Time view.
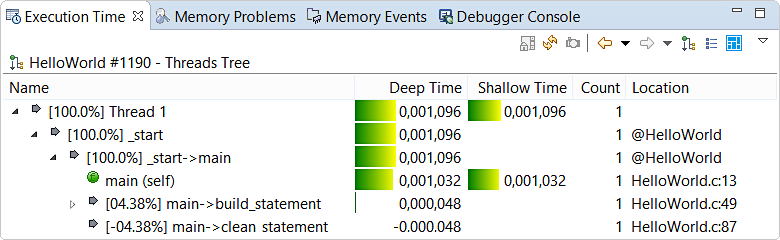
Here, the Deep Time column indicates by how much a function increased heap memory consumption (when the value is positive) or decreased it (when the value is negative). Note that a function may allocate some blocks but free others—the value shown is the net increase or decrease in heap memory. Shallow Time (if defined) reports the same metric, so you can ignore this column. Count indicates how many times the call site was executed while Location provides the source file and line of the call site.
The controls in the upper right corner allow you to display certain columns so you can see non-default metrics and to display the functions in a flat list rather than a thread-based tree, as explained in the Execution Time reference. Also, you can compare the results of two profiling sessions to see the effects of any changes you made between execution runs to improve application efficiency.