Finding memory corruption with Valgrind Memcheck
Valgrind Memcheck detects many types of memory corruption errors, including invalid accesses, uses of undefined values, and incorrect freeing of memory. The IDE parses the Memcheck results that it receives from Valgrind and displays a list of memory errors.
If your target image isn't configured to include the valgrind binaries and libraries, the IDE attempts to upload these components when you launch an application with a Valgrind tool enabled. For this to work, the target must have a writable filesystem.
- In the launch bar, expand the Launch Configuration dropdown (which is in the middle) and select the project for which you want to check memory.
- In the Launch Target dropdown (on the right), select the target for running your application.
- In the Launch Mode dropdown (on the left), select Check.
-
Click the Edit button (
 )
on the right of the Launch Configuration dropdown.
)
on the right of the Launch Configuration dropdown.
- In the configuration editor window, access the Valgrind controls by clicking the Check tab on the right and then the Valgrind radio button near the top of this tab.
- Select Memcheck from the Tool to run dropdown.
- Optional:
You can change any settings to customize what gets reported in the Valgrind results.
The Memcheck tab lets you configure how the heap block data are presented.
- Click OK to save the configuration changes and close the window.
-
In the launch bar, click the Check button
(
 ).
).
The IDE switches to the QNX Analysis perspective. If necessary, the IDE first builds the binary before uploading it to the target. To analyze the application, the IDE instructs Valgrind to execute the uploaded binary with Memcheck instrumentation. Then, it creates a new session for storing the Valgrind results; this session is displayed in the Analysis Sessions view. When the program terminates, Valgrind writes the results to a log file, which the IDE copies into the directory for the new session.
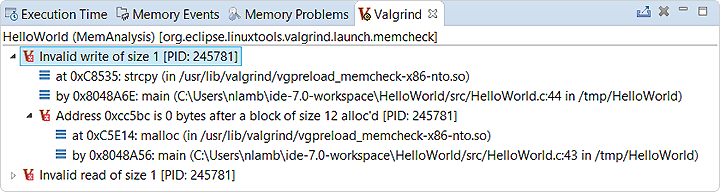
The memory error details are listed in the Valgrind view.
All error summaries contain the Valgrind icon (![]() ) followed by a descriptive message and the PID of the Valgrind process.
On the left of the icon, you can click the arrow to display a stack trace of where the error was detected.
The depth of the displayed call chain is determined by the Callers in stack trace field in the
General Options tab.
) followed by a descriptive message and the PID of the Valgrind process.
On the left of the icon, you can click the arrow to display a stack trace of where the error was detected.
The depth of the displayed call chain is determined by the Callers in stack trace field in the
General Options tab.
The stack traces should include location information for errors detected within functions of shared libraries. If you don't see this information, you must manually configure the loading of debug symbols.
If you double-click a trace line that has source file information, the IDE opens the file at the indicated line. This feature lets you quickly find where an error occured or the associated memory was allocated.