Sampling execution position and counting function calls
Any application launched through the IDE reports its execution position at regular intervals. Using the position samples, the Application Profiler can estimate function runtimes. You can also instrument a binary to make it report every function caller, so you can see call counts in the profiling results.
This profiling method has less overhead than measuring function runtimes but isn't perfect because a function can be called many times between sampling intervals and you won't see any references. Also, you can't use this method on timer-synchronized programs because the results won't be accurate.
For accurate results, you must obtain a statistically significant number of samples, so this method works best on long-running programs that spend most of their time executing code. For instance, if a server process is mostly receive-blocked while waiting for client requests and spends very little time processing them, very few position samples can be obtained and so the results would be unreliable.
To count function calls, your binaries must be compiled and linked with -p; for details, see
Enabling call count instrumentation
.
- In the launch bar, expand the Launch Configuration dropdown (which is in the middle) and select the project that you want to profile.
- In the Launch Target dropdown (on the right), select the target for running your application.
- In the Launch Mode dropdown (on the left), select Profile.
-
Click the Edit button (
 )
on the right of the Launch Configuration dropdown.
)
on the right of the Launch Configuration dropdown.
- In the configuration editor window, click the Profile tab on the right and the Application Profiler radio button near the top of this tab.
- Click the Sampling radio button under Profiling Method, and verify that Single Application is selected under Profiling Scope.
- Optional:
To see call counts for each function, check the Use Call Count Instrumentation box in the
Options panel.
Enabling this UI setting makes the IDE check that any application binary being run was built with -p. If it wasn't, the IDE doesn't launch the application and instead displays an error.
- Click OK to save the configuration changes and close the window.
-
In the launch bar, click the Profile button
(
 ).
).
The IDE switches to the QNX Analysis perspective. If necessary, the IDE first builds the binary. Then, it uploads the binary and starts running it on the target. At this time, a new session is created and displayed in the Analysis Sessions view. As the application runs, profiling results are sent to the IDE, which stores them in the new session and presents them in the Execution Time view.
The profiling results include the function runtimes, call counts, and call sites. Initially, function information for all program components is listed. You can expand the Analysis Sessions entry and click a component to filter the display. For example, you may want to see only those runtimes for functions in your program code and not in any libraries that it uses, so you can click the application binary.
You should be able to see statistics for functions in any shared libraries used by your application. If you don't, you must manually define the library paths.
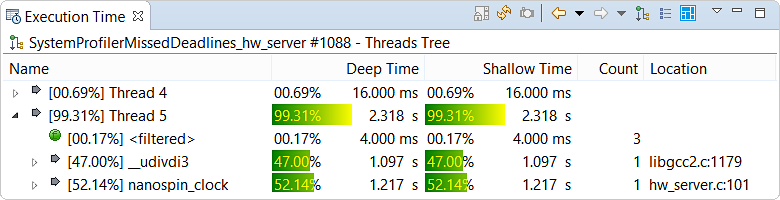
With position sampling, there's no distinction of deep versus shallow time, so both columns report the same metric. In addition to execution times, these columns display numbers and bar graphs representing the percentages of time spent in the various functions. You can change the columns displayed to see nondefault metrics, as explained in the Execution Time reference.
Like the System Information statistics, the profiling results are refreshed every five seconds (by default), so you can closely monitor changes in execution time breakdown as you interact with the application. Double-clicking on any listing with a file and line number shown in the Location column opens the source code at that location. The IDE displays a bar graph and the execution time in the left margin.