When a kernel event trace launched through the IDE finishes and you choose to open the new log file, the System Profiler editor displays the file's data. This editor is highly interactive and lets you see subsets of event data, which helps you understand component interaction and troubleshoot problems.
To manually open a trace file, choose and navigate to and select the file. All kernel event logs generated for a specific target from the IDE are stored in workspace_dir/target_conn_name.
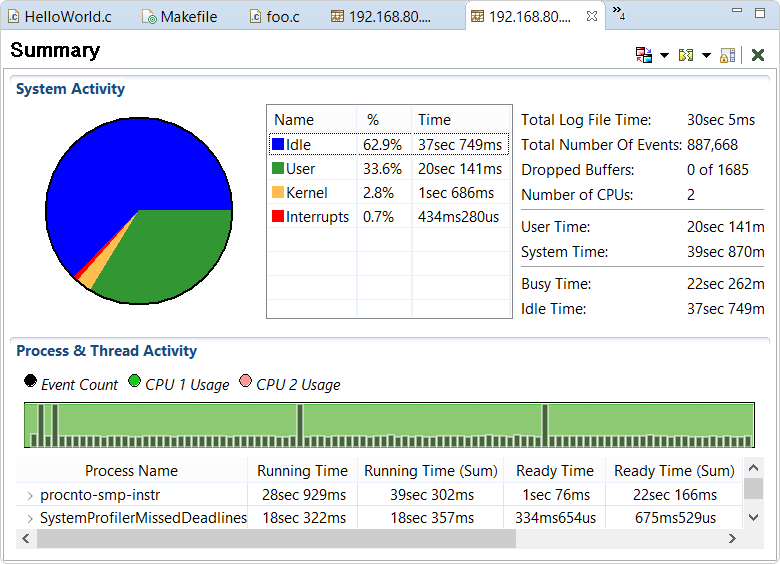
The editor lets you visualize the trace data in different ways, by selecting a
particular pane through the Switch Pane dropdown in the upper right corner (![]() ).
The panes that are most useful depend on which information you're trying to extract and which problems you're trying to solve.
In the sections that follow, we describe how to locate specific events and filter the data in the System Profiler editor to
perform common cases of analysis and troubleshooting.
).
The panes that are most useful depend on which information you're trying to extract and which problems you're trying to solve.
In the sections that follow, we describe how to locate specific events and filter the data in the System Profiler editor to
perform common cases of analysis and troubleshooting.