When you open a kernel event log file, whether you're prompted by the IDE after a kernel event trace finishes or you manually open a file copied into your workspace, the IDE uses the System Profiler editor to visually present the file's data.
The editor lets you examine the captured events through numerous panes, which visualize event data in different ways.
Initially, the editor displays the Summary pane, which shows general trace statistics such as CPU time breakdown.
But you can open another pane by clicking the Switch Pane dropdown in the upper right controls
(![]() ) and selecting an
option. Or, you can right-click in the editor and select and then a particular pane.
) and selecting an
option. Or, you can right-click in the editor and select and then a particular pane.
You can display more than one pane at a time by using the Split Display dropdown
(![]() ).
This is useful for looking at different sections of a log file and doing comparative analysis.
When you click the name of a pane that's not currently displayed, the IDE opens it. You can open up to four panes, although it
can be hard to read statistics when that many are displayed. The right-click menu has an equivalent submenu,
, as well as the
option, which lets you
alternate between stacking the panes horizontally or vertically.
).
This is useful for looking at different sections of a log file and doing comparative analysis.
When you click the name of a pane that's not currently displayed, the IDE opens it. You can open up to four panes, although it
can be hard to read statistics when that many are displayed. The right-click menu has an equivalent submenu,
, as well as the
option, which lets you
alternate between stacking the panes horizontally or vertically.
With the split display, any newly opened pane displays data based on the same events selected in the previously opened one. But the pane becomes independent right away, meaning you can change the zoom level or highlight a timeframe in its display without affecting the events selected in other panes.
If you want to synchronize the selection in multiple panes, click the Toggle Display Lock button
(![]() ) in
each one, or choose from the right-click
menu; for convenience, this menu also has the
option. After you do this,
any timeframe selection or zooming that you do in one pane automatically updates the display in the other locked panes.
) in
each one, or choose from the right-click
menu; for convenience, this menu also has the
option. After you do this,
any timeframe selection or zooming that you do in one pane automatically updates the display in the other locked panes.
To close a pane, click the close button
(![]() ) or choose
. You must leave one pane open,
so this button and option do nothing when a single pane is displayed.
) or choose
. You must leave one pane open,
so this button and option do nothing when a single pane is displayed.
Finally, the right-click menu has the Open with QNX Application Profiler option, for extracting any function profiling data into a new profiling session. Note that the Bookmark option, although present in the context menu of any pane, really applies to the Timeline pane only.
Summary
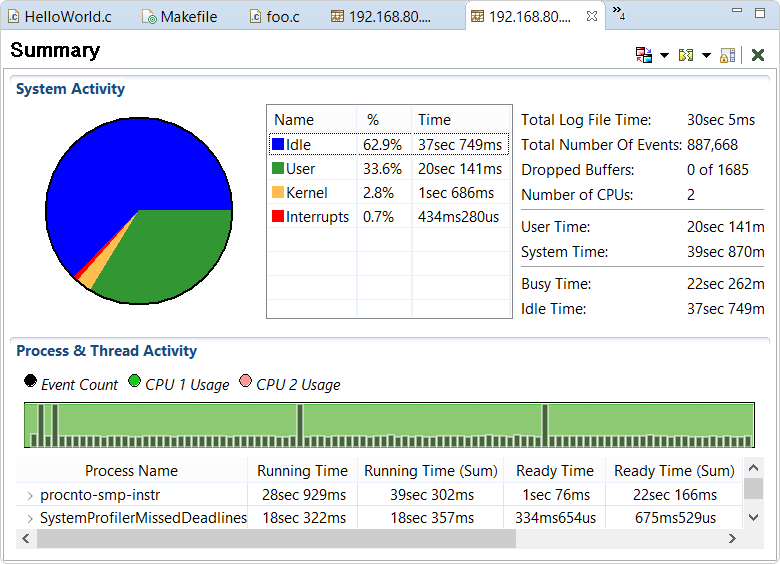
- how long the trace ran
- how many events occurred
- user time, which is the CPU time spent running user code
- system time, which is the sum of the idle, kernel, and interrupts times
- State Time
- For processes, this is the total time during the trace period when at least one of their threads was in the given state.
- Consider a process with two threads running on different processors or cores. The first thread runs from 0 to 3 s within the trace period and the second thread from 0 to 1 s. The Running Time column shows 3 seconds because the two threads ran over a three-second interval.
- For threads, which can run on only one CPU core at a time, this is their total time in that state throughout the trace.
- State Time (Sum)
- For processes, this is the sum of all individual thread times for that state, throughout the trace. In the previous example,
the Running Time (Sum) column shows 4 seconds because this is how much runtime was used by the two
threads, even though their overlapping execution meant they finished running by the 3 second mark.
Note: This column can differ from the previous one only for processes on multiprocessor or multicore systems. With single-processor single-core systems, only one thread in the system can be moved into a given state at a time. For threads, the columns always match because they can't run on multiple CPU cores concurrently.
The Process & Thread Activity table contains the same information that you can extract by examining a particular time range of the kernel event log using the General Statistics view.
CPU Activity
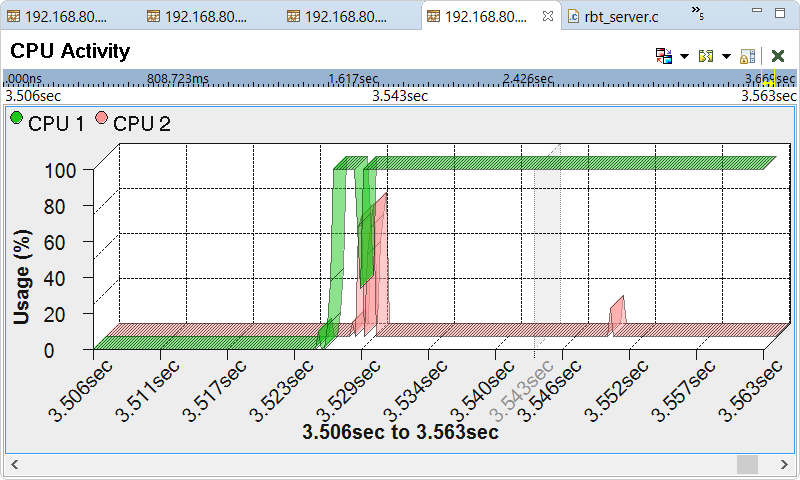
The default chart type is a 3D line graph. You can right-click anywhere in the pane and in the Graph Type submenu, select another type based on a 2D or 3D display, lines or bars, or what shading to use.
The zoom feature lets you scale the graph to better see changes in CPU load over short timeframes.
To change the zoom level, you can use the zoom in
(![]() ) and zoom out
(
) and zoom out
(![]() ) buttons in the upper left
corner of the IDE. There are equivalent options in the right-click menu. For Zoom In, you can first select
a region of the graph by clicking and dragging the mouse, then click this option to zoom in on the highlighted timeframe.
The right-click menu also has the Zoom Level submenu, which lets you return to the full-scale graph
(i.e., at 100%) or set a custom zoom level. Above the graph, the yellow band in the timescale and the start and end times are
updated to reflect the time period now displayed.
) buttons in the upper left
corner of the IDE. There are equivalent options in the right-click menu. For Zoom In, you can first select
a region of the graph by clicking and dragging the mouse, then click this option to zoom in on the highlighted timeframe.
The right-click menu also has the Zoom Level submenu, which lets you return to the full-scale graph
(i.e., at 100%) or set a custom zoom level. Above the graph, the yellow band in the timescale and the start and end times are
updated to reflect the time period now displayed.
CPU Migration
The CPU migration pane tells you how many times the kernel migrated threads between CPUs, for whatever reason. This information is useful for finding performance problems on multiprocessor or multicore target systems. Note that this pane is meaningful only for these system types.
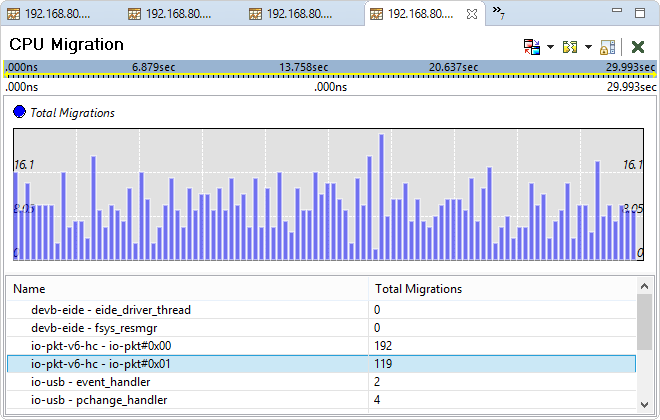
The zoom feature lets you scale the graph to better examine CPU migrations over short timeframes. The controls are the same as those for the CPU Activity pane. Unlike in this other pane, however, you can't change the chart type.
Individual bars represent the number of CPU scheduling migrations over fixed time intervals. The migration count is incremented whenever a thread switches CPUs, so the peaks in the graph indicate times when there was a lot of contention for certain CPUs. Frequent CPU migration reduces performance because the instruction cache is regularly flushed, invalidated, and reloaded on the new CPU.
The length of the time intervals represented by the bars is based on the time period displayed. Thus, when you zoom in, these intervals get shorter. As well, the vertical axis of the graph is rescaled based on the maximum number of migrations for a thread in the newly selected timeframe, and the table is refreshed based on the graph.
In addition to total migrations, the kernel trace also tracks how many threads are migrated due to cross-CPU communication. This is shown in Inter CPU Communication.
CPU Usage
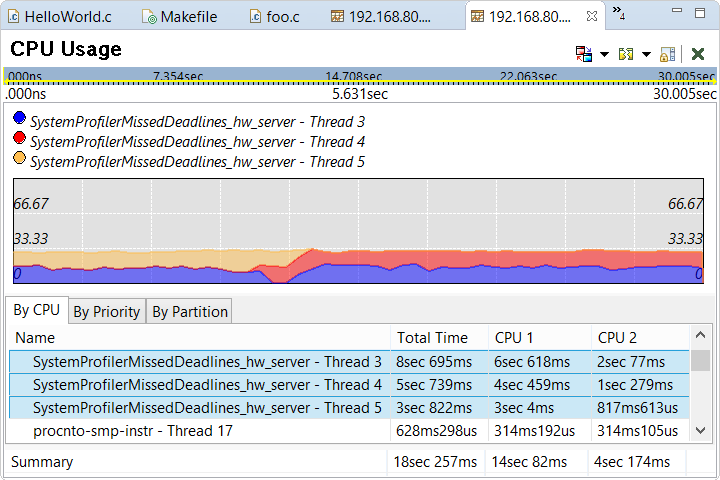
The zoom feature lets you scale the graph to better read changes in CPU consumption over short timeframes. The controls are the same as those for the CPU Activity pane.
The table area contains three tabs that display the times that various threads ran on individual CPUs, at specific priority levels, and within certain partitions. The last tab shows data only if the target uses adaptive partioning. For all three tabs, the threads are initially sorted by their total running times across all CPUs (in descending order), but you can click the column headers to change the sorting order.
The measurements reflect the CPU consumption over the time period selected in the chart. By default, they appear as percentages followed by time values, but you can display just one of these metrics or both of them in reverse order, by selecting and clicking an option in the Table Data Format dropdown. This same preference dialog lets you switch between a line and an area chart, using the Chart Type dropdown.
Clicking table rows updates the graph to display the CPU usage history of the associated threads. Multi-select is supported, by holding the Ctrl and/or Shift keys, similar to Windows Explorer. Below the table, a summary row displays the sums of the values for the selected threads.
Inter CPU Communication
The Inter CPU Communication pane shows you how often the kernel migrated threads due to message passing. This information helps you find performance bottlenecks caused by messaging on multiprocessor or multicore target systems. Note that this pane is meaningful only for these system types.
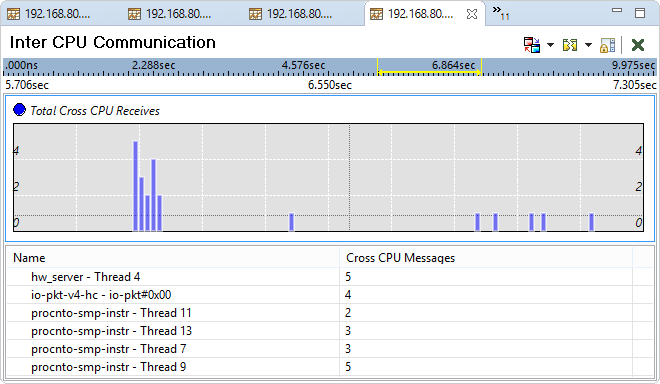
This pane tells you how many cross-CPU messages were exchanged. When a message-sending (client) thread and the corresponding message-receiving (server) thread run on different CPUs, the message sending data must be migrated from the client's CPU to the server's. This activity reduces performance because the first CPU's cache is invalidated when the data get moved.
You can adjust the zoom level to see the message-related migration counts for specific time periods. The bars then change to reflect new fixed time intervals based on the timeframe now displayed and the table gets updated, similar to the CPU Migration pane. Note that this other pane reports how often threads were migrated for any reason, not just due to messaging.
Partition Summary
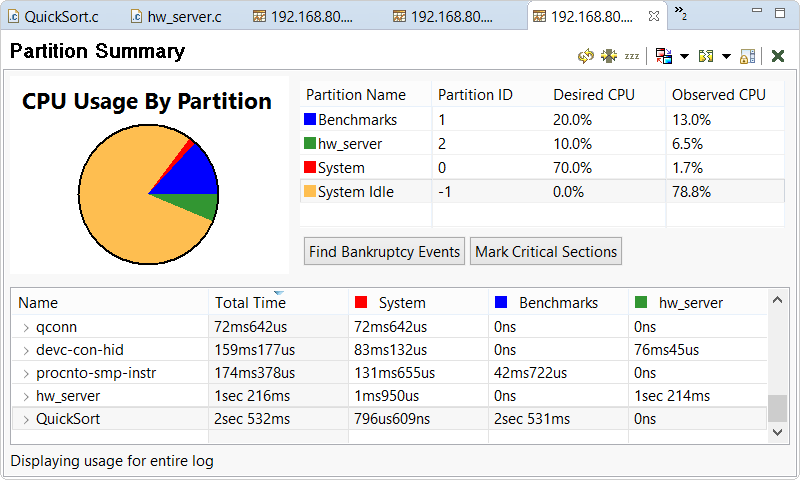
- Find Bankruptcy Events — searches for all APS Bankruptcy events and displays the results in the Search view
- Mark Critical Sections — adds bookmarks for all events marking the entry into a critical section; the newly marked events are listed in the Bookmarks view
In the bottom area, the table lists the per-event owner CPU usage across all partitions and within each one. A process can run threads in separate partitions, and a thread can switch partitions, using the SchedCtl() C library function. For more information about adaptive partition scheduling and examples of using this API to configure it, see the Adaptive Partitioning User's Guide.
By default, the statistics shown reflect the entire trace period, even if you selected a time range in another pane.
To see the CPU usage metrics for only the highlighted range, click the Focus on Range Selection button
(![]() ), then click Refresh
(
), then click Refresh
(![]() ).
).
Whenever you select another time range, you must refresh this pane using the second button. You can click the two buttons again (in the same order) to disable the range selection focus and redisplay the statistics from the entire kernel trace. The reason for this design is that the calculations for finding CPU usage by partition are intensive enough that the System Profiler doesn't automatically perform them as soon as you change the timeframe selection.
At the bottom of the pane, the status bar indicates the time range that the current statistics reflect.
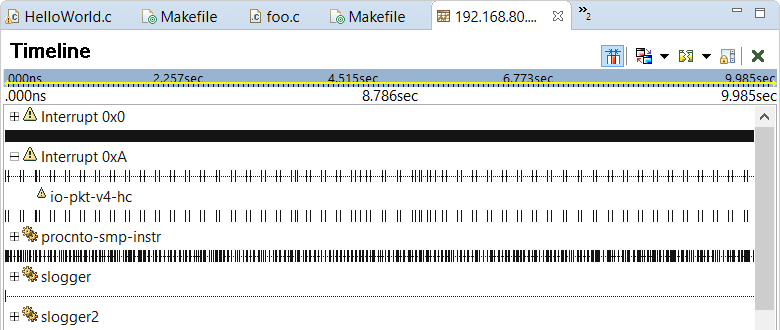
Timeline
Given the huge number of events in even brief traces, you typically have to zoom in considerably to find an exact event sequence
of interest (e.g., a message exchange or unexpected thread scheduling). To change the zoom level, you can use the zoom in
(![]() ) and zoom out
(
) and zoom out
(![]() ) buttons in the upper left
corner of the IDE. There are equivalent options in the right-click menu. For Zoom In, you can first select
a region of the graph by clicking and dragging the mouse, then click this option to zoom in on the highlighted timeframe.
The right-click menu also has the Zoom Level submenu, which lets you return to the full-scale graph
(i.e., at 100%) or set a custom zoom level. Above the graph, the yellow band in the timescale and the start and end times are
updated to reflect the time period now displayed.
) buttons in the upper left
corner of the IDE. There are equivalent options in the right-click menu. For Zoom In, you can first select
a region of the graph by clicking and dragging the mouse, then click this option to zoom in on the highlighted timeframe.
The right-click menu also has the Zoom Level submenu, which lets you return to the full-scale graph
(i.e., at 100%) or set a custom zoom level. Above the graph, the yellow band in the timescale and the start and end times are
updated to reflect the time period now displayed.
The Timeline pane lets you scroll vertically, to see timelines from different owners, and horizontally, to navigate to earlier or later in the trace period when you're zoomed in. With this last action, the timescale selection is automatically updated.
Initially, a summary timeline is drawn for each process and interrupt vector. The tick marks on this timeline represent specific events belonging to any thread within the process or any interrupt handler attached to the vector. You can click the plus sign (+) next to the owner's name to display the timelines for its threads or handlers; when you do this, the summary tick marks are cleared. Clicking the minus sign (-) next to an expanded owner hides these other timelines and redraws the summary marks.
Timeline: Hover-based information
- processes — process name and PID
- threads — TID and parent process information
- interrupts — interrupt vector number, in hexadecimal and decimal
- interrupt handlers — name of process in which handler runs, and interrupt vector number
Timeline: Owner and event selection
To select an owner, click its name. The owner and its summary timeline are highlighted in grey, and you can then find specific events or navigate between events within the selection. Multi-select is supported, by holding the Ctrl and/or Shift keys when selecting processes, similar to Windows Explorer.
Multi-select is supported for events differently than for owners. You can hold Shift and click two events to select the timeframe between them, which is useful for zooming in on a specific event sequence.
Timeline: Navigation
| To navigate to the: | Click this toolbar button: | Use this shortcut key: |
|---|---|---|
| Previous event by the same owner | ||
| Previous event in the selection | Ctrl–Shift–Left | |
| Previous event | Ctrl–Left | |
| Next event | Ctrl–Right | |
| Next event in the selection | Ctrl–Shift–Right | |
| Next event by the same owner |
You can navigate directly to an event. When the editor is in focus, pressing Ctrl–L or selecting opens a window that lets you enter a sequence number, timestamp (in nanoseconds), or event cycle. When you provide one such value and click OK, the System Profiler looks for the event. If it finds the event, it moves the yellow arrow marker and highlights the owner in the Timeline pane. For the timestamp, the IDE navigates to the event closest to the specified time.
Some QNX System Profiler views, such as Trace Event Log and General Statistics, are synchronized with the Timeline pane; selecting an event in one display navigates to that event in the other display. Thus, if the event marker seems to have jumped unexpectedly, most likely, you clicked a table row in one of these views. When you change the timerange selection in the Timeline pane, you can then filter the statistics shown in General Statistics; for details, see the General Statistics reference.
Timeline: Scrolling
| To navigate: | Use this shortcut key: |
|---|---|
| To the top of the owner list | Home |
| Up by one screenful | Page Up |
| Up by one owner | Up |
| Down by one owner | Down |
| Down by one screenful | Page Down |
| To the bottom of the owner list | End |
Timeline: Find
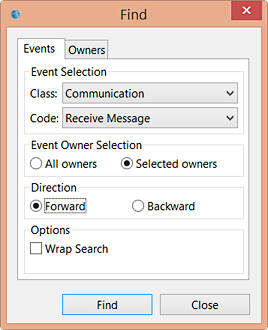
- class
- code (event type)
- search scope, either all owners or the selected ones
- search direction (forward or backward)
- whether to wrap the search
If you click the Owners tab on the right, you can then select a single thread in which to search. The text field at the top lets you begin typing the thread name, to filter the list. Multi-select is not supported.
When you click Find, the System Profiler navigates to the first matching event found. This simple search feature is good for most times when you want to locate an event, but you can also search for events matching specific criteria, as explained below.
Timeline: Search
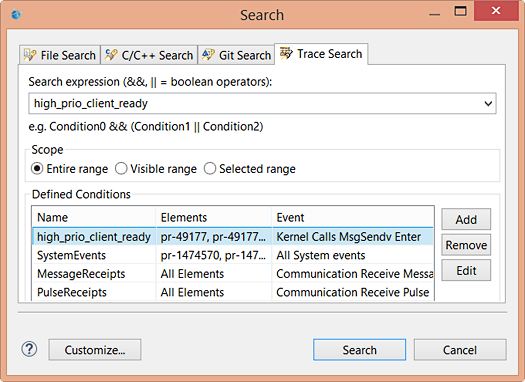
The Search expression field at the top lets you name one or more search conditions to use. You can combine results from multiple conditions by specifying the AND (&&) and OR (||) operators between condition names. You can also use the dropdown on the right to choose exactly one condition.
The radio buttons in the middle let you choose the search scope, which can be the entire trace, the timeframe scrolled to in the editor, or the selected timeframe (which is the area colored light grey).
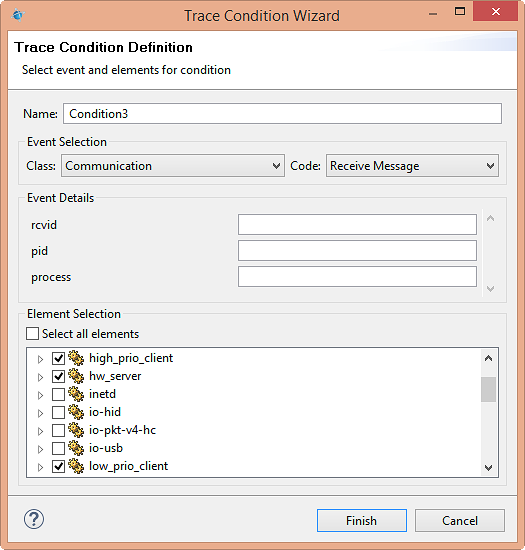
Through the text field at the top, you can give the new condition an insightful name. Below, you can select a class, code (event type), and other data fields related to the code; these last fields appear after you select a specific class and code. By default, the Select all elements box is checked (in the bottom area), so the search applies to all owners. But you can uncheck this box and select one or more owners from the list that appears, to restrict the search. Also, you can expand entries for processes and interrupt vectors to choose individual threads and handlers.
- sequence number within the log
- timestamp, relative to the trace start
- owner
- event type
- all type-specific data fields
You can customize which details are shown by selecting Configure Trace Event Table in the upper right
dropdown (![]() );
this action opens a window in which you can select individual columns to display.
);
this action opens a window in which you can select individual columns to display.
You can select individual rows with the left mouse button and multiple rows by also holding down Ctrl and/or Shift. This allows you to remove only those events by using the first control outlined just below, but also to copy the corresponding event data to the clipboard (using Ctrl–C) and then paste the data into an Excel workbook or another program that reads data in CSV format.
-
Remove Selected Items (
 )
)
-
Remove All Items (
 )
)
-
Run the Current Search Again (
 )
)
-
Cancel Current Search (
 ) — This is active only when the search is running.
-
Show Previous Searches (
 ) — This dropdown lists recent searches so you can easily
rerun them (by clicking their entries) and provides options to access the full history and clear the history.
) — This dropdown lists recent searches so you can easily
rerun them (by clicking their entries) and provides options to access the full history and clear the history.
-
Pin the Search View (
 ) — This button lets you keep the current results for reference.
When this button is clicked, the next time you run a search, the IDE displays the results in a separate window.
) — This button lets you keep the current results for reference.
When this button is clicked, the next time you run a search, the IDE displays the results in a separate window.
Timeline: Bookmarks
Bookmarks help you keep your place in a kernel event log.
To bookmark an event, click its tick mark and then right-click and choose Bookmark.
(There's also a bookmark button, ![]() , in the upper left toolbar.)
In the resulting window, you must enter a description for the bookmark. When you do so and click OK,
the IDE adds the event to those listed in the Bookmarks view. In this way, you can annotate a log file to
mark the most interesting events.
, in the upper left toolbar.)
In the resulting window, you must enter a description for the bookmark. When you do so and click OK,
the IDE adds the event to those listed in the Bookmarks view. In this way, you can annotate a log file to
mark the most interesting events.
At any time, you can double-click a row in this view to directly navigate to an event that you bookmarked. You can also choose Go To from the context (right-click) menu. This menu also has options for copying the event data to the clipboard, deleting the selected entries, selecting all events, and viewing the properties of a single event. When you select two events, you can choose Select Range in Editor to select the timeframe between them.
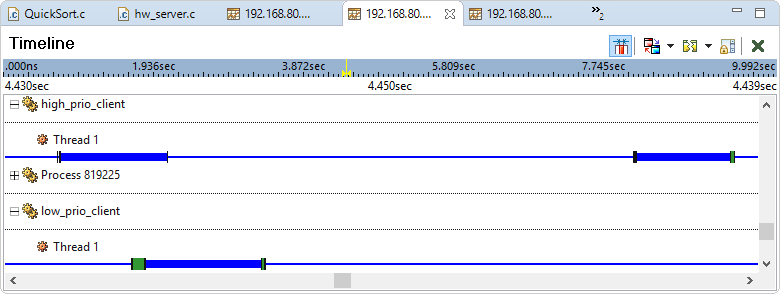
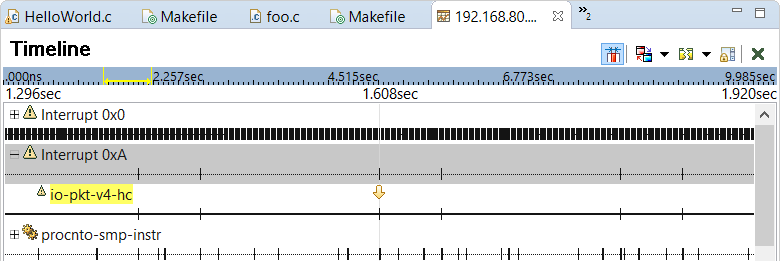
Timeline: IPC representation
The Timeline pane can illustrate IPC activity such as message exchanges by displaying arrows between the owners involved. This lets you quickly see when certain processes and threads interacted with each other.
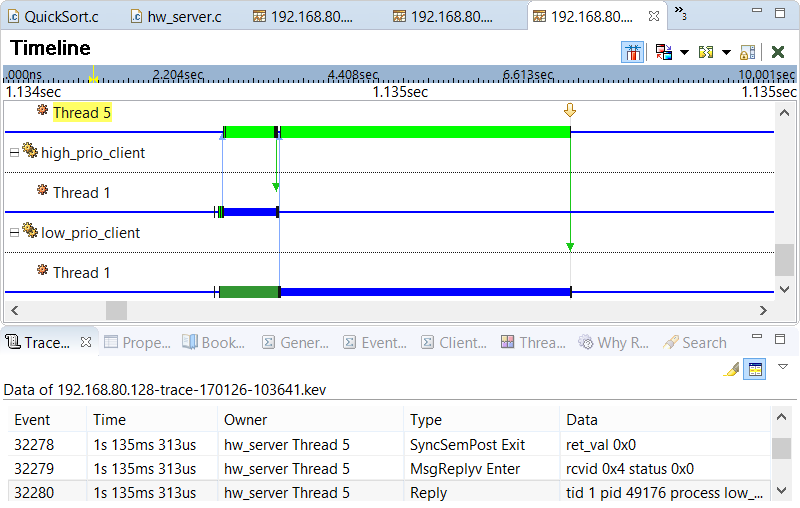
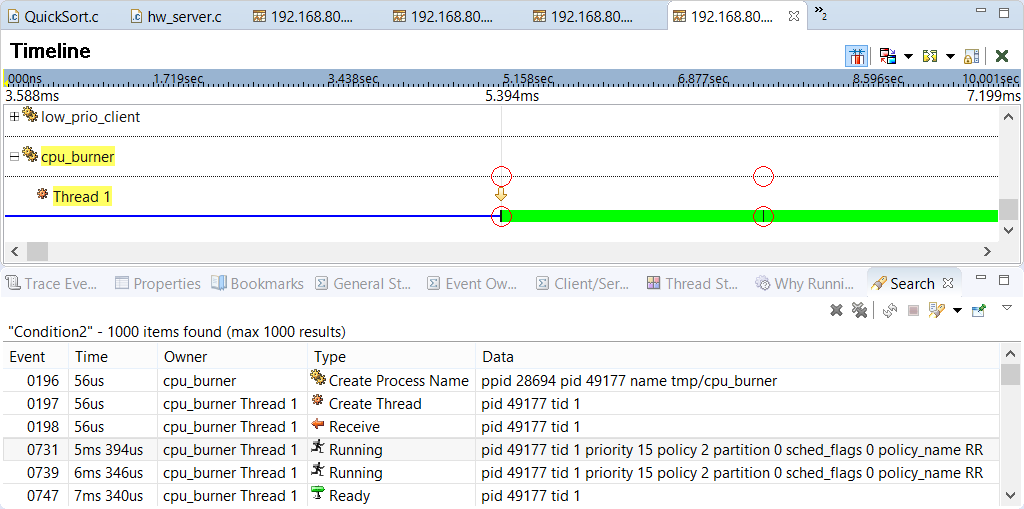
Pulses are indicated by orange arrows. Message sends are shown in blue while replies are shown in either green, for a successful reply, or red, for an error reply. In this example, the user has selected a Reply event from hw_server Thread 5. The arrow is green to indicate that the server replied to the client (low_prio_client Thread 1) after its request succeeded. Earlier in the timeline (i.e., to the left of the selected event), we can see a blue arrow between the same two owners but pointing in the opposite direction; this indicates the client's message send containing the request.
Timeline: Event labels
You can annotate timelines with event labels to easily distinguish between event types and see data associated with individual events. This latter feature is particularly helpful for matching Function Entry and Function Exit events with function names.
- Priority Labels — for Running events, shows the owner's priority level
- State Labels — for State events, shows the owner's new state; this means you don't have to remember the colors for specific states
- State Icons — shows icons representing state changes; this saves space compared to names, but you must recognize the icons
- IPC Labels — for Communication events, shows the name of the thread receiving the message or pulse or being replied to
- Event Labels — for message-related events, shows entries into key functions (e.g., read(), write())
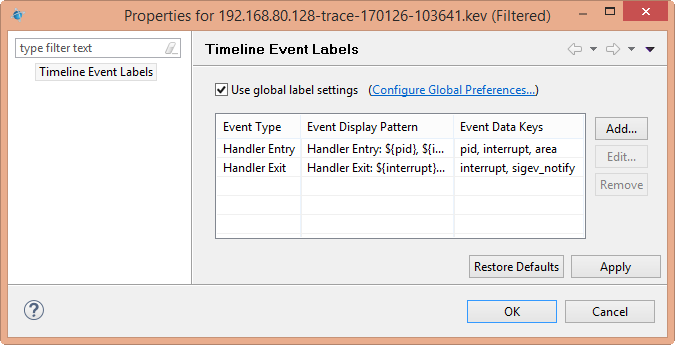
By default, Use global label settings is checked, so the System Profiler inherits the label display settings preconfigured for common events such as MsgSendV Enter. The link next to this box lets you change the default display settings used by all traces. The window opened by this link has the same table listing of individual settings and the same controls for configuring them as the first window. Note that you can also access the global label settings through .
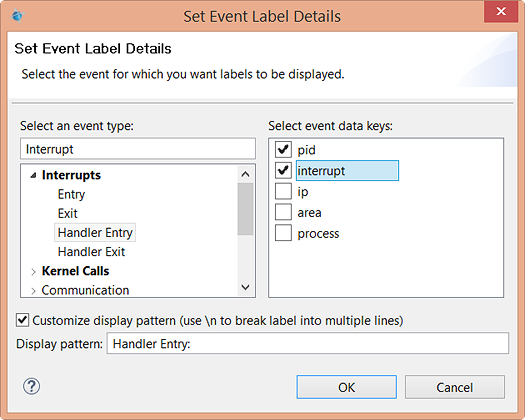
- Data keys are specified by using $data_key_name$; in the Timeline pane, they're replaced with the actual event values for the given keys.
- To make the label text span multiple lines, use \n.
Timeline: Renaming processes and threads
Renaming processes and threads makes the Timeline pane more readable. Often, threads are unnamed, so this feature allows you to better identify them based on their purpose. If you run tracelogger in ring mode, the thread names are lost, so this way, you can assign your own names when viewing the trace results.
To rename an event owner, first select it (by left-clicking) in the Timeline display. Then, either right-click and choose Rename or press F2, and type the new name.