If you notice an application missing its deadlines, it may be experiencing priority inversion. The System Profiler lets you examine thread state change events that happened very rapidly so you can recognize if one thread prevented another thread of a higher priority from running, even for only a short time.
For an explanation of priority inversion, see the “Priority inheritance” section in the Getting Started with QNX Neutrino guide. That topic describes a client-server interaction that emphasizes the need for priority inheritance, which entails temporarily setting a thread's priority to the highest priority of any other thread that's blocked (even indirectly) by that first thread. Here, we present a scenario in which a lack of priority inheritance causes priority inversion.
Whenever possible, you should use mutexes instead of semaphores around critical sections. In QNX Neutrino, mutexes propagate priority levels (and hence, support priority inheritance), so they prevent priority inversion. They aren't the same as binary semaphores, which don't propagate priorities. If you inherit code from a third-party or can't reasonably avoid semaphores in your code, you have to follow the process outlined here to detect priority inversion.
- priority inheritance was disabled for threads created on the channel or for the mutex used
- mutexes are used but the application doesn't assign the right priorities for client and server threads
Determining which threads ran at certain times
To detect priority inversion, you must find which higher-priority threads were prevented from running and which lower-priority threads got to run instead. In the Timeline pane, you can examine the thread states at the time your application first became slow or unresponsive.
Initially, the pane displays timelines for all event owners (sources), which include all threads in all processes. This information can be hard to interpret given the large number of owners in most systems. To read the timelines effectively, you must understand your system well enough to know which threads were likely involved in priority inversion. You can then filter the timeline display to show only the relevant timelines.
Given that thread scheduling happens very quickly, you must also know fairly precisely when the non-optimal scheduling occurred, likely to within a few milliseconds. To help you find the related event sequence, you can use the zoom feature to examine short timeframes within the trace.
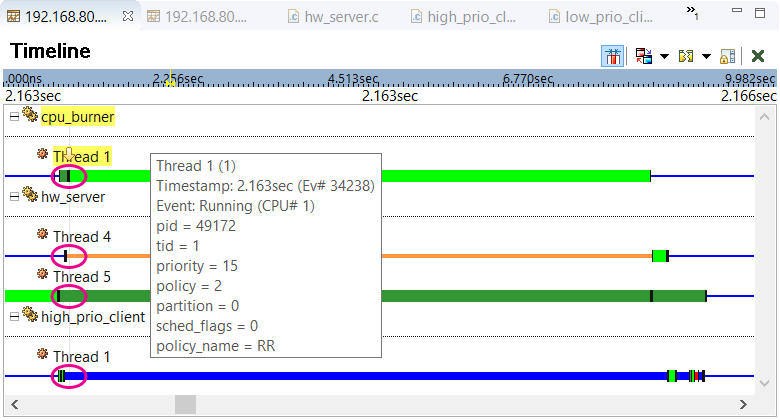
Based on the state coloring used by the System Profiler, we can see that hw_server Thread 5 was Ready,
hw_server Thread 4 was Semaphore Blocked, and high_prio_client Thread 1 was Reply Blocked while
cpu_burner Thread 1 was Running. For readability, you can show the state names by selecting
State Labels in the Toggle Labels dropdown (![]() ) in the upper left toolbar.
Information about the default mapping of colors to states and how to change that mapping is found in the
Timeline State Colors reference. Note that the pink ellipses shown here are callouts in the
diagram, to make these color changes stand out, and not actually drawn by the IDE.
) in the upper left toolbar.
Information about the default mapping of colors to states and how to change that mapping is found in the
Timeline State Colors reference. Note that the pink ellipses shown here are callouts in the
diagram, to make these color changes stand out, and not actually drawn by the IDE.
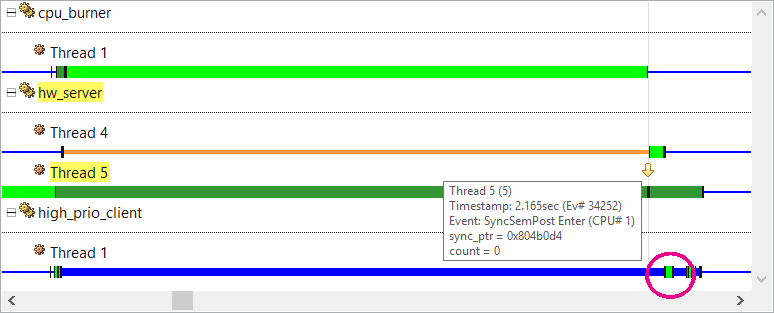
Here, the user clicked a SyncSemPost Enter event from hw_server Thread 5 and hovered the pointer to show the event details. This semaphore post (release) apparently unblocked Thread 4, as seen by the color change in this other thread's timeline. This other thread apparently then replied to high_prio_client Thread 1, as seen by the client thread's timeline color change. Again, the pink circle here is a callout in the diagram and not drawn by the IDE.
With priority inheritance, the client's higher priority of 40 would have been propagated to Thread 4 and Thread 5. This latter server thread would have run before the cpu_burner thread and released the semaphore, allowing the other two threads to complete their work. But because semaphores were used instead of mutexes, no priority inheritance was done and thus, priority inversion occurred.
Finding events that caused priority inversion
The Timeline pane works well if you have a good idea of exactly when priority inversion occurred and which threads were involved. But given the huge number of events in most traces, it can be more practical to search for the events emitted when an application misses its deadlines. When this happens, many applications write messages to a log file or output stream. Our program uses printf(), which calls write(), which calls MsgSendV(). We can then search for the event that's emitted when the kernel enters this last function and that's owned by the high-priority thread that we think was improperly delayed.
Using the Trace Search tab of the Search dialog (which is accessed through or Ctrl–H), we create a search condition for MsgSendV Enter events for high_prio_client Thread 1. Instructions on creating and configuring search conditions are given in the System Profiler reference.
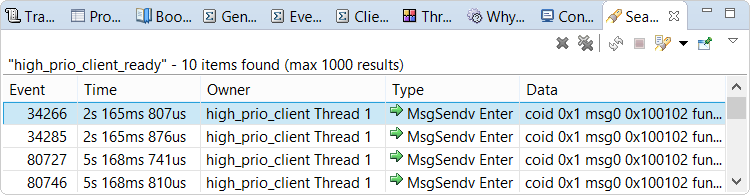
You can double-click a row in the results to navigate to that event in the timeline display. In addition to highlighting the event with a yellow arrow and dotted vertical line, the Timeline pane draws red circles around it and other events of the same type. The toolbar in the upper left corner of the IDE provides buttons for navigating between events in the timeline.
In our case, we want to know why high_prio_client Thread 1 didn't run sooner. To find out, we click the
Previous Event By Owner button (![]() ) to navigate to this thread's last Ready
event. If we then click the Previous Event button (
) to navigate to this thread's last Ready
event. If we then click the Previous Event button (![]() ) to navigate to the immediately preceeding
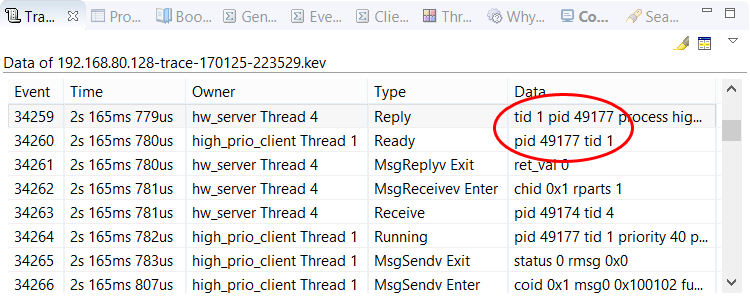
event, we see that hw_server Thread 4 replied to the client thread.
This is evident from the matching TID and PID values given in the Reply and Ready events.
) to navigate to the immediately preceeding
event, we see that hw_server Thread 4 replied to the client thread.
This is evident from the matching TID and PID values given in the Reply and Ready events.
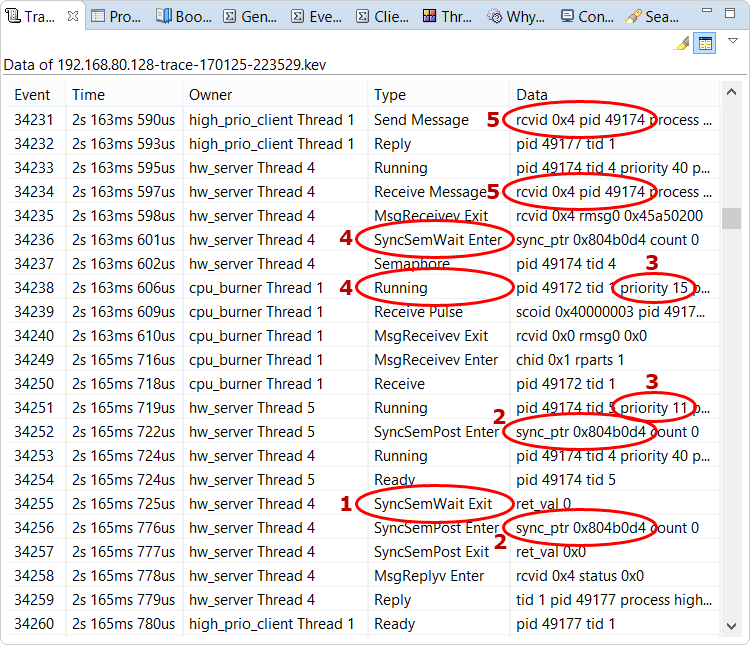
- hw_server Thread 4 was waiting on a semaphore, as indicated by its SyncSemWait Exit event.
- hw_server Thread 4 couldn't continue its work until hw_server Thread 5 released the same semaphore, as shown by the matching addresses in the SyncSemPost Enter events of these server threads.
- hw_server Thread 5 couldn't run until cpu_burner Thread 1 finished running, as seen by the Running events that show the server thread had a lower priority than this other thread.
- hw_server Thread 4 was waiting on the semaphore before cpu_burner Thread 1 was scheduled to run, as indicated by the order of the SyncSemWait Enter and Running events for these threads.
- high_prio_client Thread 1 was waiting for a reply from hw_server Thread 4, as shown by the matching PIDs in the Send Message and Receive Message events for these threads.
Viewing the CPU usage of threads of different priorities
You can confirm the shift in CPU assignment from the high-priority to medium-priority thread by switching to the
CPU Usage pane.
To do this, select the option with this name in the Switch Pane dropdown in the editor controls
(![]() ).
This pane contains a graph that illustrates the CPU usage history of any thread selected in the table underneath.
The time period displayed matches the Timeline selection, so the graph should be zoomed in enough
to easily see the CPU usage changes that resulted from the priority inversion.
).
This pane contains a graph that illustrates the CPU usage history of any thread selected in the table underneath.
The time period displayed matches the Timeline selection, so the graph should be zoomed in enough
to easily see the CPU usage changes that resulted from the priority inversion.
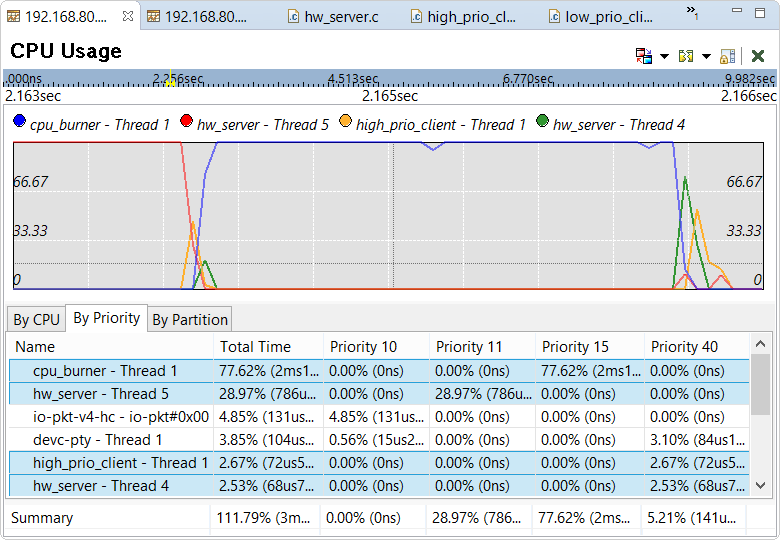
The By Priority tab displays how long the threads ran at specific priorities. Priority inversion is evident because the cpu_burner thread ran at level 15 for about 2 ms but high_prio_client Thread 1 and hw_server Thread 4 ran at level 40 for well under 1 ms each. Also, the graph shows CPU usage rising and dropping quickly for these two threads at around 2.164 s into the trace. This pattern suggests that the client and server were communicating briefly just before both stopped executing for awhile. Indeed, both threads began executing again after the medium-priority thread finished running at around 2.166 s, presumably because the server was able to do the requested work and reply to the client.