Memory Analysis is a QNX tool that uses the debug version of the memory allocation library (librcheck) to track heap memory, validate pointer arguments to C library functions, and detect memory corruption. When the tool is active, it displays data received from the librcheck library about memory events and problems that occur in the application being analyzed.
How to configure Memory Analysis
You can enable the Memory Analysis tool by selecting Memory as the launch mode. Although this mode supports other integrated tools, Memory Analysis is selected by default. Aside from Memory mode, you can select any other mode except Coverage and enable this tool by opening the launch configuration and clicking the Memory Analysis radio button in the rightmost tab.
- Memory Errors
- Memory Tracing
- Memory Snapshots
- Advanced Settings
Memory Errors
- Enable error detection
- Enables or disables memory error-checking; you can disable this feature but retain its settings
- Verify parameters in string and memory functions
- When enabled (as by default), makes Memory Analysis verify pointers passed to functions such as memcmp() and strcpy() and report bad values (including NULL) as errors
- Perform full heap integrity check on every allocation/deallocation
- Whether to inspect the entire heap every time memory is allocated or deallocated and report any corruption. Full heap validations are expensive, so this setting is disabled by default.
- Enable bounds checking (where possible)
- Whether to check for data being written before the beginning or after the end of allocated blocks (default: enabled). This checking is done only for dynamically allocated blocks.
- Enable check on realloc()/free() argument
- Whether to check the pointer argument passed to realloc() or free() (default: enabled)
- When an error is detected
- The action to take when a memory error is detected. The default setting is report the error and continue but you can also choose launch the debugger or terminate the process.
- Limit back-trace depth to
- Specifies how many frames up the stack the tool should look when reporting memory corruption errors. If you set this field to 1, Memory Analysis lists only the line where the error occured. A value of 2 makes it list the error line and the line in the calling function.
- A greater depth creates greater overhead, so there's a trade-off between performance and the level of stack data reported. You can set a value of 0 for an unlimited depth.
- Perform leak check every
- The time interval, in milliseconds, to check for memory leaks. Leak checks add overhead, so you must pick an interval value based on how quickly you want to detect leaks versus how much overhead you can tolerate. You can set a value of 0 to disable leak checking.
- For this option to work, the control thread must be enabled in the Advanced Settings.
- Perform leak check when process exits
- When enabled (as by default), makes Memory Analysis check for memory leaks when the process exits. Some leaks can be caught only if this option is enabled. For this option to work, the application must exit “cleanly” by calling exit() or in the main() function, return.
Memory Tracing
- Record memory allocation/deallocation events
- Enables or disables memory tracing; you can disable this feature but retain its settings
- Limit back-trace depth to
- Specifies how many frames up the stack the tool should look when reporting memory allocation traces. If you set this field to 1, only the exact line where memory was allocated is shown. A value of 2 shows the allocation line and the line in the calling function.
- A greater depth creates greater overhead, so there's a trade-off between performance and the amount of stack data reported. A value of 0 disables memory allocation tracing.
- Minimum allocation to trace
- The minimum size, in bytes, for a block of memory to be included in the allocation stack trace results. A value of 0 (the default) means there's no filtering of small blocks.
- Maximum allocation to trace
- The maximum size, in bytes, for a block of memory to be included in the allocation stack trace results. A value of 0 (the default) means there's no filtering of large blocks.
Memory Snapshots
- Memory Snapshots
- Enables or disables memory snapshots; you can disable this feature but retain its settings
- Perform snapshot every
- The periodic time interval (in milliseconds) for taking heap snapshots. Each snapshot captures details about the full block list of the heap. Performing regular snapshots lets you see how the heap contents change over time. The default value is 50 000 milliseconds.
- Bins counters
- A comma-separated list specifying the sizes, in bytes, for defining the bins (groups) when reporting the allocation counts in the Bins tab. Suppose you fill in this field with 32, 256. The heap snapshot results will then contain separate counts for memory blocks up to 32 bytes in size, between 32 and 256 bytes, and more than 256 bytes.
- If you leave this field blank, the default block size boundaries are powers of 2, from 2 B up to 4 KB, with an additional upper boundary of 2 GB to cover large blocks.
Advanced Settings
- Runtime library
- The filename of the allocation library to use to collect memory data. You would change this field only when working with an older SDK version and using a nondefault library.
- Use regular file / Use streaming device
- Whether to output the data to a regular file or a streaming device. By default, Use regular file is selected. In this case, the qconn service can't become blocked when writing data, but there's a file size limit of 2G. This setting is handy for postmortem analysis.
- When Use streaming device is selected, the data is streamed directly to the IDE using a device path created by qconn. There's no size limit on the data that can be logged, but qconn becomes blocked if it sends data faster than the IDE can read it.
- Target output file or device
- Path of the file or device on the target for outputting the memory data. When Use regular file is selected, this field defaults to /tmp/traces.rmat. If many developers are using the same target, change the filename to be user-specific or add ${pid} to the name, to use the PID of the running process.
- When Use streaming device is selected, this field is set to /dev/rcheck/traces.rmat.
- Create control thread
- Create a thread to handle data requests at runtime. This setting is enabled by default and is required for doing regular leak checks.
- Use dladdr to find dll names
- This field isn't used when you're working with the SDK from QNX SDP 7.0 or the librcheck.so runtime library, so it's unavailable by default. If you switch to an older SDK version and enter libmalloc_g.so in the Runtime library field, this checkbox then becomes available. In this case, the Use dladdr field must be checked if you want to see backtrace information from shared objects (dynamically-linked libraries) built with debugging information.
- Show debug output on console
- Show the librcheck output in the Console view (default: disabled)
How the tool works
When Memory Analysis has been enabled in the launch configuration, the application uses the debug version of the allocation library, librcheck. This library version tracks the history of all dynamic memory blocks and generates data about where in the program each block was allocated or freed. It also contains its own implementations of memory- and string-related functions, such as memcmp() and strcpy(), so it can validate pointer arguments passed to them and report any invalid pointers.
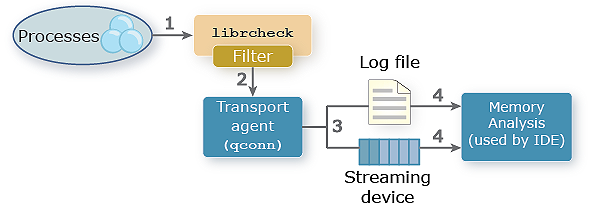
Figure 1. Memory Analysis: data flow
Reacting to process memory activity
Whenever an application process allocates or frees memory, or calls any function implemented in librcheck, the library generates data describing the memory activity.
Sending data to the transport agent
The librcheck library doesn't interact directly with the IDE on the host. Like other runtime analysis components, librcheck must send its data to a transport agent. In this example, we show the qconn service, but you could use any service that talks to the IDE over an IP connection.
Logging data to an output file or device
The qconn agent outputs the memory data to either a local file or a streaming device, depending on the advanced settings.
Reading and presenting the data
Within the IDE, the Memory Analysis tool reads the memory data from the log file or streaming device, then visually presents the data in a new analysis session.
How Memory Analysis results are presented
When you launch an application with Memory Analysis enabled, the IDE switches to the
QNX Analysis perspective and
opens the Memory Analysis editor,
which displays charts illustrating the application's heap usage.
In the Analysis Sessions view, the IDE creates a new session for storing the analysis results.
Each open Memory Analysis session has a header containing the tool's open session icon
(![]() ), the binary name, the session number, and the launch time.
), the binary name, the session number, and the launch time.
Under the header, all processes in the program being analyzed are listed. You can expand each process entry to see the threads, the executable binary, any shared libraries, and all source files that run within that process. For source files compiled into the executable binary, they're shown only if the binary was built with debug information. For source files compiled into shared libraries, you must have a debug version of these libraries within the shared libraries path on the host to see them listed.
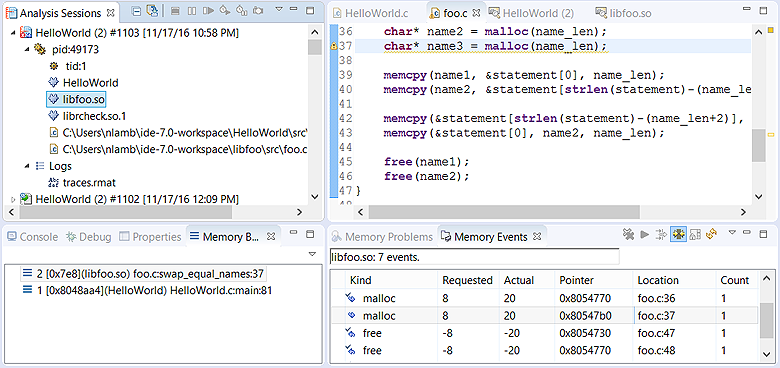
Each session also has a Logs entry that lists the filename (without the path) specified in the Target output file or device field. If you double-click this item, the IDE opens the log containing the analysis data gathered so far. This action is handy when you're working with QNX customer support and you need to look up something specific. When the session ends, you'll see the trace (.rmat) file stored in workspace_dir/.metadata/.plugins/com.qnx.tools.ide.common.sessions.core/sessions/session_number/. You can then import these analysis results to view them later.
Finally, you can reopen a closed session (which is indicated with a different icon,
![]() ) by double-clicking its Analysis Sessions
entry. The IDE then redisplays the program components for this session in that same view and the heap usage charts in the
editor pane.
) by double-clicking its Analysis Sessions
entry. The IDE then redisplays the program components for this session in that same view and the heap usage charts in the
editor pane.
Error details and messages
- Severity — Either Error, for memory read and write errors, or Leak, for leaks
- Description — Informative message summarizing the error
- Pointer — Address of the memory block involved
- Trap Function — Function that trapped the error
- Alloc Kind — Type of allocation used for the associated block
- Binary — Executable or library file where the error occurred
- Location — Source file and line of code where the error occurred. For this field to be meaningful, debug symbols must be available for the file.
You can change which details get displayed by clicking the dropdown button
(![]() )
in the upper right corner of the view and choosing Preferences. This action opens a popup window
that lets you choose the columns to display and the order to list them, from left to right.
)
in the upper right corner of the view and choosing Preferences. This action opens a popup window
that lets you choose the columns to display and the order to list them, from left to right.
| Error Message | Meaning |
|---|---|
| allocator inconsistency - Malloc chain is corrupted, pointers out of order | A buffer overflow occurred in the heap and it's now corrupted. |
| allocator inconsistency - Malloc chain is corrupted, end before end pointer | A buffer overflow occurred in the heap and it's now corrupted. |
| pointer does not point to heap area | The program attempted to free non-heap memory. |
| possible overwrite - Malloc block header corrupted | A buffer overflow occurred in the heap and it's now corrupted. |
| allocator inconsistency - Pointers between this segment and adjoining segments are invalid | A buffer overflow occurred in the heap and it's now corrupted. |
| data has been written outside allocated memory block | The program attempted to write data to a region beyond the allocated memory. |
| data in free'd memory block has been modified | The program attempted to write data to a region that was previously freed. |
| data area is not in use (can't be freed or realloced) | A buffer overflow occurred in the heap and it's now corrupted. |
| unable to get additional memory from the system | There is no more heap memory that can be allocated. |
| pointer points to the heap but not to a user writable area | A buffer overflow occurred in the heap and it's now corrupted. |
| allocator inconsistency - Malloc segment in free list is in-use | A buffer overflow occurred in the heap and it's now corrupted. |
| malloc region doesn't have a valid CRC in header | A buffer overflow occurred in the heap and it's now corrupted. |
| free'd pointer isn't at start of allocated memory block | The program attempted to deallocate a pointer that shifted from its original value returned by the allocator. |
| memory leak of size n | A heap block of size n has been lost. |
Event details
- Kind — Type of memory operation (malloc, calloc, new, free, etc.). The arrow icon points right for allocations and left for deallocations. When the icon has a checkmark, there's a matching request. For example, an allocation with a checkmark has a corresponding free.
- Requested — Number of bytes requested
- Actual — Number of bytes actually allocated or deallocated
- Pointer — Address of the memory block involved
- Location — Source file and line of code where the event occurred. For this field to be meaningful, debug symbols must be available for the file.
- Count — Number of individual allocations (this is more than 1 only when they're grouped)
You can change which details get displayed by clicking the dropdown button
(![]() )
in the upper right corner of the view and choosing Preferences. This action opens a popup window
that lets you choose the columns to display and the order to list them, from left to right.
)
in the upper right corner of the view and choosing Preferences. This action opens a popup window
that lets you choose the columns to display and the order to list them, from left to right.
How to use the Memory Analysis editor
When you launch a Memory Analysis session, the IDE automatically opens an editor window that shows the analysis results for that session. These results are refreshed regularly as the program runs. If you double-click any component within a session, the IDE opens another window to display only the results for that component. You can open such windows for both active and finished sessions.
- Allocations
- Bins
- Bands
- Usage
- Settings
Windows showing program-level data display all five tabs. Windows displaying data for a program component display only the Allocations tab.
Allocations tab
- Details — In the top part of the editor, this chart illustrates the byte sizes of the memory blocks related to the events selected in the bottom part.
- Memory Allocation and Deallocation Events — In the bottom part of the editor, this chart provides an overview of memory events.
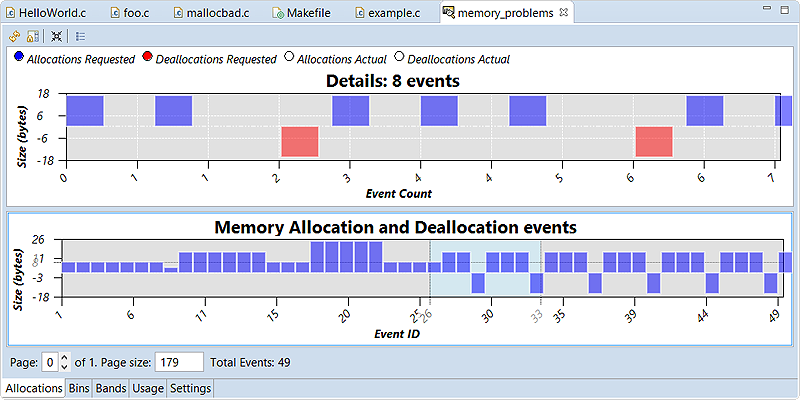
The Details chart uses a 2D bar chart format by default. You can change the format by right-clicking anywhere in the top part of the editor, choosing Chart types, then choosing one of these four options: BarChart (the default), BarChart_3D, Differentiator, and Differentiator_3D.
The radio buttons just above the Details chart determine which types of events are graphed. By default, requested allocations and deallocations are displayed, but you can also display actual allocations and actual deallocations to see how much the heap memory footprint grows or shrinks.
The Memory Allocation and Deallocation Events chart illustrates the byte sizes for memory events too, but for a larger section of the session data set. In this bottom chart, the byte size range is shown along the vertical axis and by default, the event ID range is shown along the horizontal axis.
- Filters
- Open the Memory Events Filter window so you can set fields for filtering the events shown in the two charts
- Zoom In
- After you've selected a subset of events, click this option to zoom in on those events
- Zoom Out
- After zooming in on a subset of events, click this option to zoom out again
- Show Events Table
- Update the Memory Events view to display information about the selected subset of events
Initially, the data set from the entire session is graphed. Because the bottom chart can get quite wide if there's a lot of data, you can divide the chart into different “pages” to display only part of the data set at a time. To do this, in the Page Size text field just below the chart, enter the number of events that you want to see at a given time. On the left of this text field is a spinner that lets you manually enter a page to display, or navigate between pages with the arrow buttons.
- Reload (
 ) — Load the latest analysis results and redraw the charts
to show them; this action is meaningful only for active sessions
) — Load the latest analysis results and redraw the charts
to show them; this action is meaningful only for active sessions - Prevent Auto-refresh (
 ) — For active sessions, disable the automatic updating of
the chart
) — For active sessions, disable the automatic updating of
the chart - Toggle Overview Chart (
 ) — Toggle the visibility of the bottom chart
 - Show Events Table (
 ) — Update the Memory Events view to
display information about the selected subset of events
(this is the same as the last option in the bottom chart's context menu)
) — Update the Memory Events view to
display information about the selected subset of events
(this is the same as the last option in the bottom chart's context menu)
Memory Events Filter
- Memory Events Filter
- Defines memory block properties required for a memory event to appear in the charts:
- Hide matching allocation/deallocation pair
- Whether the block must be associated with an unmatched allocation or deallocation operation. Unmatched operations often indicate leaks or errors.
- Show only events for retained objects
- Whether the block must have been kept in memory instead of being deallocated. Blocks like this are common sources of leaks or errors.
- Requested size range
- The amount of bytes requested. For this field and other range-based fields, you can enter two values separated by a dash (-) to indicate the inclusive minimum and maximum range values, or enter one value for an exact match.
- Band size
- The band of memory that the associated block is allocated from or freed to. Bands are groups of small, preallocated memory blocks of the same size. In this field, you must enter the exact band size (not a range).
- Pointer
- The pointer values (addresses). You can enter one address (0x80832c8), or a range of addresses (0x80832c8-0x80832f0).
- Memory Events Kind
- Specifies which types of memory events will appear in the charts. Here, “event type” means which C or C++ memory-management function or operator was called (e.g., malloc(), realloc(), new, delete).
- Range
- Defines the range of events to display, based on either timestamps or event IDs
- Files
- Lists the files in which a memory event must have occurred for it to appear in the charts
- Binaries and Libraries
- Lists any of the executable binaries and shared library files in which a memory event must have occurred for it to appear in the charts
- Threads
- Lists the threads in which a memory event must have occurred for it to appear in the charts
Bins tab
This tab displays memory statistics based on bins, which group together events based on the sizes of the memory blocks involved. The librcheck library maintains bin allocation counts, updating these counts as the program allocates or deallocates blocks within the corresponding size ranges.
In the Bins tab, these counts are displayed in the Details: Blocks per Bin chart in the top left area. The horizontal axis lists the bin size ranges while the vertical axis lists the blocks count. The size ranges are based on the Bins counters field under Memory Snapshots. If you leave this field blank, the bin size ranges are based on powers of 2, with a special bin for large allocations between 4 KB and 2 GB.
The Blocks per Bin chart in the bottom area illustrates the changes in blocks count, with timestamp values (in microseconds since the program start) shown along the horizontal axis and the blocks count shown along the vertical axis. A separate line is drawn for each bin, in a specific color.
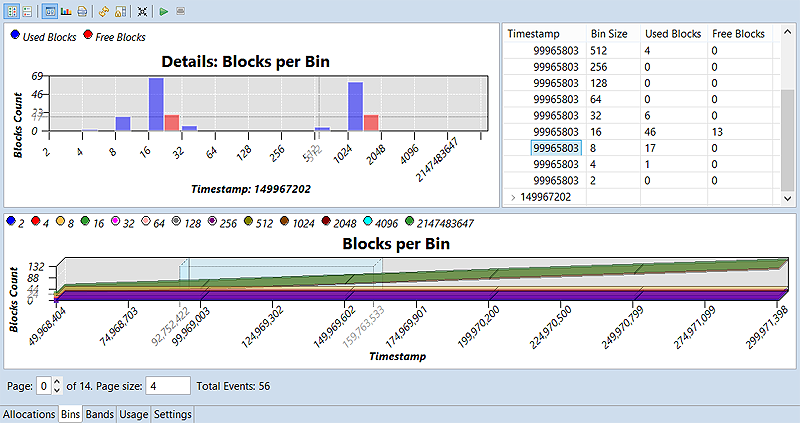
The radio buttons just above the top chart control which types of blocks (used or free) are graphed. Also, you can change the type of this chart through its right-click menu, which has two options: BarChart (the default) or BarChart_3D. For the bottom chart, the radio buttons let you show and hide individual lines, and you can right-click to select LineChart_3D (the default) or LineChart as the chart type.
The Detail pane in the upper right corner lists the number of used and free blocks in each bin, for each timestamp within the selected region of the bottom chart. The information is displayed in a table, with expandable rowsets for each timestamp. When you expand a rowset and click the leftmost column in a specific row, the top chart is refreshed to show the blocks count for that timestamp.
- Play (
 )
— play the events selected in the bottom chart, by illustrating them in the top chart
)
— play the events selected in the bottom chart, by illustrating them in the top chart - Stop (
 )
— stop playback
)
— stop playback
Bands tab
For efficiency, the system allocator preallocates bands of small buffers for satisfying small allocation requests. This saves programs from a trip through the kernel's memory manager, thus improving performance. Any activity in these bands is shown on the Bands tab.
In the top left area, the Details: Blocks per Band chart displays the blocks count for all bands. The horizontal axis lists the band sizes while the vertical axis lists the blocks count. The band sizes are an allocator property that depends on the memory header size and the alignment for the CPU.
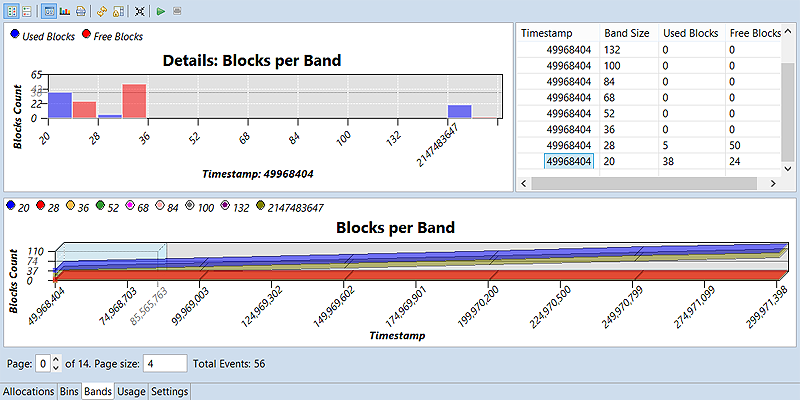
The radio buttons just above the top chart control which types of blocks (used or free) are graphed. Also, you can change the type of this chart through its right-click menu, which has two options: BarChart (the default) or BarChart_3D. For the bottom chart, the radio buttons let you show and hide individual lines, and you can right-click to select LineChart_3D (the default) or LineChart as the chart type.
The Detail pane in the upper right corner lists the number of used and free blocks in each band, for each timestamp within the selected region of the bottom chart. The information is displayed in a table, with expandable rowsets for each timestamp. When you expand a rowset and click the leftmost column in a specific row, the top chart is refreshed to show the blocks count for that timestamp.
The Bands toolbar contains the same buttons as the Bins toolbar.
Usage tab
- Heap Usage Snapshot — In the top left area, this piechart illustrates the relative sizes of the used, free, and overhead heap portions, in terms of percentage of memory consumption.
- Heap Usage Trend — In the bottom area, this line chart illustrates the changes in size for each heap portion.
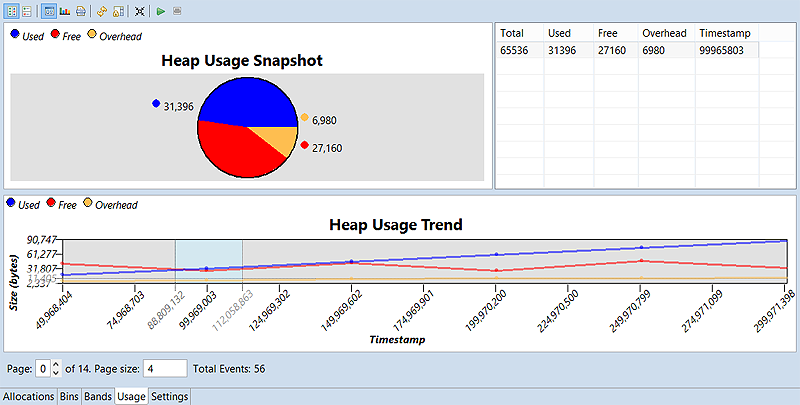
The radio buttons just above the top chart control which types of blocks (used, free, or overhead) are graphed. Also, you can change the type of this chart through its right-click menu, which has three options: BarChart, BarChart_3D, or PieChart (the default). For the bottom chart, the radio buttons let you show and hide individual lines, and you can right-click to select LineChart_3D, LineChart (the default), or AreaChartStacked as the chart type.
The Detail pane in the upper right corner displays a table that lists the total, used, free, and overhead byte sizes of the heap, for each timestamp within the selected region of the bottom chart.
The Usage toolbar contains the same buttons as the Bins and Bands toolbars.
Settings tab
This last tab lets you adjust Memory Analysis settings only for active sessions. You can't change the Advanced Settings but you can change any field in the Memory Errors, Memory Tracing, and Memory Snapshots dropdowns. Any new settings take effect when you click the Apply button in the toolbar.
- Collect Memory Leaks (
 )
) - Get Memory Snapshot (
 )
) - Gather Allocation Traces (
 )
)
Running Memory Analysis and the GDB Debugger concurrently
-
After selecting the project, target, and Debug mode in the launch bar, click the Edit button
(
 ) on the right of the
Launch Configuration dropdown.
) on the right of the
Launch Configuration dropdown.
- Ensure that the Stop on startup at box is checked in the Debug tab, or that you have an active breakpoint at the first line in your program.
-
In the Tools tab, ensure that the Memory Analysis radio button is selected and the Create control thread box is unchecked (disabled) under Advanced Settings.
Running a separate data-collection thread can cause the application to deadlock when the debugger is also running. If you disable this thread, your program must call the librcheck API to perform leak checks and memory tracing at runtime. Note that you can't send signals to a target process to control librcheck when no control thread is running.
-
Optional: You can specify nondefault Memory Analysis settings. To do so:
- Click the Memory tab on the right.
In the Memory Analysis controls, change any settings to customize what gets reported.
You can adjust how Memory Analysis measures heap usage, enable or disable specific memory checks, and turn tracing on or off and specify block size tracing limits.
- Click OK to save the configuration changes and close the window.
-
When you're ready to debug and analyze your application, click the Debug button (
 ).
).
The IDE launches the application and attaches the debugger, which stops execution at the startup location specified in the Debug tab. A new Memory Analysis session is shown in Analysis Sessions.
-
If you don't see the gdb output in the Console view, click the
Display Selected Console button (
 ) in the upper right area and
select the gdb entry.
) in the upper right area and
select the gdb entry.
-
Tell the debugger to ignore the SIGSEGV signal, with this command: handle SIGSEGV nopass
Sometimes, the debugger tooling does unsafe operations and causes the OS to emit this particular signal. This directive tells gdb to not pass this signal onto the program.
- Click Resume in the Debug view toolbar, or type continue and press Enter in the Console view.
The program continues execution until the next breakpoint. When execution stops again, you can view the stack trace and other useful information in the Debug perspective. You can also switch to the QNX Analysis perspective and view the Memory Analysis data gathered up till that point, in the editor pane.
CSV file contents for exported event data
If you export Memory Analysis results to a CSV file, the resulting data in the file depends on the event type selected in the Export Memory Analysis Data window.
The tables shown below list the fields exported to the CSV file, in the order in which they're written, for each event type reported by Memory Analysis. If you want to see field names in the column headers when viewing the data in a spreadsheet application (e.g., Excel), be sure to check Generate header row in the export controls window.
| Name | Description |
|---|---|
| Session Name | Abbreviated session name, which is just the binary name without the session number or timestamp shown in the Analysis Sessions entry. |
| Session Time | When the session was created. For an imported session, it's the time of the import, not the time of creation. |
| Event ID | Unique ID for the memory event. |
| Time Stamp | Timestamp of when the event occurred on the target machine. |
| Process ID | PID of the process. |
| Name | Description |
|---|---|
| Thread ID | TID of the thread. |
| CPU | CPU number (for multicore machines). |
| Alloc Kind | Memory operation type (e.g., malloc, free). |
| Actual Size | Number of bytes in the allocated block. |
| Requested Size | Number of bytes requested by the program. |
| Deallocation | Whether the memory block was freed. |
| Pointer | Pointer value associated with the event. |
| Source Location | Location in the source code where the memory was allocated. |
| Root Location | Location in the source code for the root of the stack trace; typically, this is main() or a thread entry function. |
| Full Trace | Full stack trace for the allocation. |
| Name | Description |
|---|---|
| Thread ID | TID of the thread. |
| CPU | CPU number (for multicore machines). |
| Message | Error message returned. |
| Pointer | Pointer value associated with the event. |
| Trap Function | Function where the error was caught. |
| Alloc Kind | Type of allocation for the argument (pointer) being validated. |
| Severity | Error severity. |
| Memory State | Whether the pointer memory is used or free. |
| Source Location | Location in the source code where the memory was allocated. |
| Root Location | Location in the source code for the root of the stack trace; typically, this is main() or a thread entry function. |
| Full Trace | Full stack trace for the error. |
| Full Alloc Trace | Full allocation stack trace for the pointer. |
| Name | Description |
|---|---|
| Size | Maximum size, in bytes, for the bin to which the memory belongs. The bin size ranges are based on the Bins counters field under Memory Snapshots. The default size ranges are based on powers of two, with a special bin for large allocations between 4 KB and 2 GB. |
| Allocations | Number of allocated blocks in this bin. |
| Deallocations | Number of freed blocks in this bin. |
| Name | Description |
|---|---|
| Size | Size, in bytes, of the preallocated band of memory used. |
| Total Blocks | Number of total blocks in this band. |
| Free Blocks | Number of free blocks in this band. |