The Code Coverage tool provides information about which lines of code have been executed. This tool is useful during testing because it tells you whether the code coverage of your test plan is acceptable.
How to configure Code Coverage
- Code Coverage data format
- The version of gcc code coverage (gcov) metrics to collect.
- You must select a metrics version based on the SDK you're using to build your program. You can switch between SDKs to build your program using a different SDP installation. For the GCC version supported by a specific SDP release, see the QNX SDP Release Notes.
- Code Coverage data scan interval
- The polling interval, in seconds, used by the IDE to request coverage data from the qconn target agent. Frequent polling creates constant network traffic, so you should avoid small values. Usually, the default value of 5 seconds is sufficient.
- Comments for this coverage session
- Your notes about the session, for your own use. These comments appear at the top of generated reports.
- Directory (on target) for temporary coverage data
- The target location for writing the code coverage data files. Any binary with code coverage instrumentation outputs a .gcda file for each source file in the program. By default, this field names the directory that the executable binary is uploaded to.
- The default upload directory is /tmp but you can override this setting in the Upload tab of the launch configuration. Usually, /tmp is linked to /dev/shmem so it's writable but temporary, meaning the data files will be gone if the target is rebooted. Note that if the directory is not writable, no files are written.
- You can click Browse to select a target directory from a file selector.
- Clean old data on the target (if it exists)
- When the box is checked (as by default), the IDE deletes data files that were generated from previous coverage sessions and are stored in the current data directory. If you uncheck this box, the IDE reads these data files when you launch the application and displays the statistics stored in those files in a new coverage session. Then, the displayed statistics are updated to reflect any additional coverage based on the program's latest activity.
- Collect data for
- This panel lets you select which source files generate code coverage data. The All sources compiled with code coverage box is checked by default, which means all source files generate data (assuming they're compiled for code coverage).
- If you want to see line coverage data for only some files in the program, uncheck this box and click Select. This action opens a popup window that lets you pick the files for which you want to see data.
- The Advanced button opens the Remote data collection parameters window, which lets you select the signal that the IDE sends to qconn when requesting coverage data (the default is SIGUSR2). You can choose Disable dynamic collection from the dropdown to disable this requesting. There's also a checkbox for suspending the application threads when coverage data is being flushed. By default, this setting is enabled.
How the tool works
When you build a binary with code coverage instrumentation, the compiler inserts code that counts, at run time, each execution of a basic block. Execution of individual lines is not counted because the required instrumentation would adversely affect both the size and execution time of the binary. The basic block counts are gcov metrics and are sent by the binary to the qconn agent.
In this release, the IDE also uses the branch coverage metrics collected by gcov. These metrics include the number of times a branch was executed (which is really how many times the branch condition was evaluated), and the number of times each branch was taken. This second metric is quite helpful for ensuring that your tests cover every branch, which is essential for complicated programs.
When you launch an application with the Code Coverage tool enabled, the tool requests coverage data from qconn at regular intervals, as defined in the launch configuration. The IDE uses the block count data that it receives to calculate the line coverage for the program. To map code blocks to specific lines, the Code Coverage tool needs the notes (.gcno) files generated when the binary was built. Then, the IDE visually presents the line coverage data in a new code coverage session.
How Code Coverage results are presented
When you launch an application in Coverage mode, the IDE switches to the
QNX Analysis perspective and in the
Analysis Sessions view, displays a new session containing the coverage data for the running program.
The session header contains the code coverage session icon (![]() ), the binary name, a session number (which gets incremented each time
a program is run with any analysis tool that displays its results in this perspective), and finally, a timestamp showing
the launch time.
), the binary name, a session number (which gets incremented each time
a program is run with any analysis tool that displays its results in this perspective), and finally, a timestamp showing
the launch time.
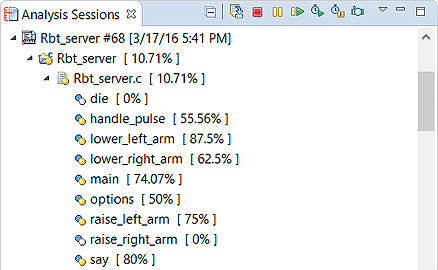
Each code coverage session also has a Logs container that lists an XML-based log file (session.gcs), which stores details such as the session name, number, and start time.
 — the line was fully executed
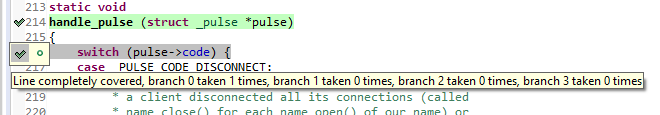
 — the line was partially executed;
if you hover the pointer over one of these markers, the IDE shows what percentage of the line was executed
— the line was partially executed;
if you hover the pointer over one of these markers, the IDE shows what percentage of the line was executed — the line was not executed
A branch is any programming element that causes the code to not continue executing in a linear way. In addition to the obvious C/C++ branching constructs of if, else, for, while, and switch, the && and || operators introduce their own branches, and there may be others created by calls to inline functions or compiler optimizations.
You can view the data from any previous session by expanding it and examining the coverage percentages for its files and functions. If you don't see these components listed when you first expand a session, right-click it and choose Open.
How to set report properties
- Save to directory
- The directory the report is written to. The IDE pre-populates this field with the following default path: project_dir/project_name___GCC_Code_Coverage_.
- Root filename
- The HTML file that provides a summary page for the report. This file is stored in the directory named in the previous field, and contains line coverage measurements for the program, each source file, and each function.
- Include source files in report
- You can check this box to make the IDE include the source code in the report. In this case, the summary page contains links to the result pages for individual source files and functions.
- Include branch coverage in report
- You can check this box to make the IDE include branch coverage details in the report.
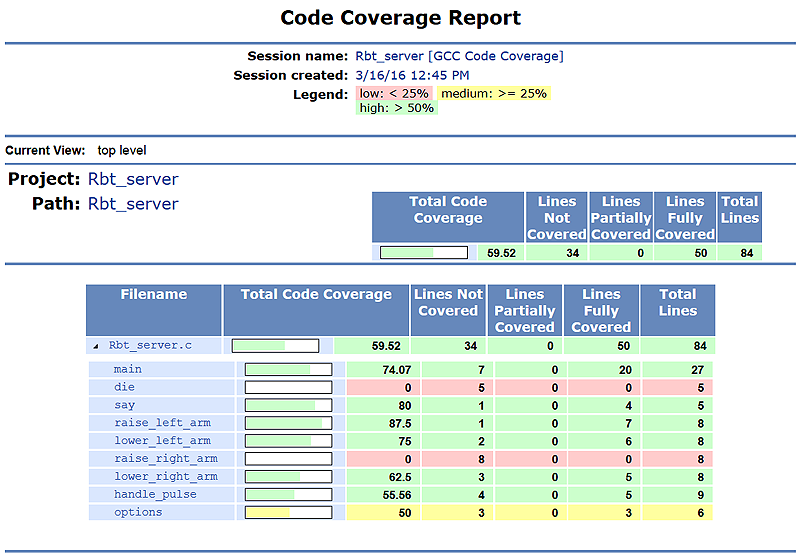
- Color code results
- When this box is checked, you can enter threshold values in the text boxes below to visually distinguish between high, medium, and low code coverage in the results. Threshold values let you classify coverage based on the exact percentage of lines executed, instead of the standard metrics of full, partial, and no coverage. Note that the value for high coverage that you enter must be greater than that for medium coverage.
- By default, the Color code results box is unchecked and so the standard metrics are used.
- Open browser on export
- When enabled, the IDE opens the preferred browser and displays the report as soon as the report is generated. You can set the preferred browser through , in the External web browsers list.
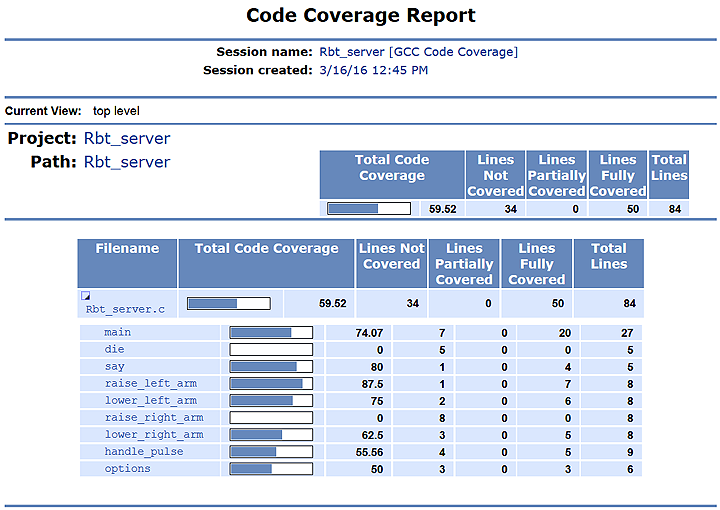
How to read reports
The IDE writes the report as a set of dynamic HTML files. The main output directory stores the HTML root file and the supporting CSS, JavaScript, and icon image files. In a subdirectory named after the project, additional HTML files store the coverage results for source files and functions.
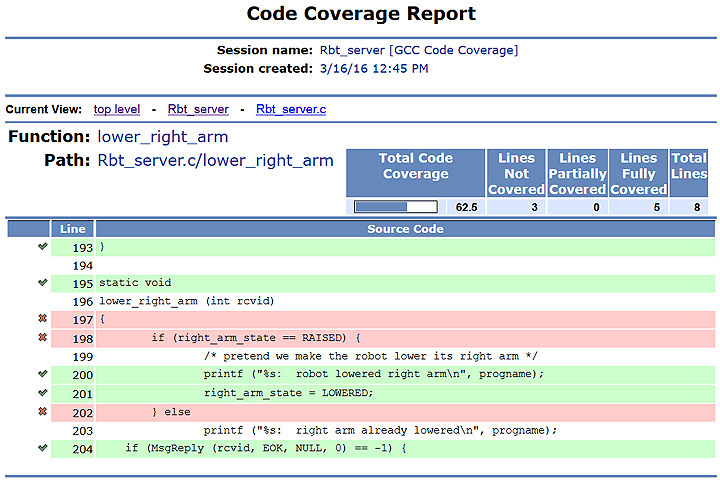
When you open a source file, there's a field, Source View, shown just above the code. This field lets you toggle between seeing all of the source code lines or only the uncovered lines. Clicking the latter setting lets you quickly see the areas of code missed by your test program. The Source View field isn't shown for functions; when you click a link to a function, you see only its code (with the coverage markup).
You can also add coverage data from included files to the report, by setting the right code coverage preference. When this preference is specified, the summary page has entries for functions in included files (in addition to those functions in the project source files).
If you leave the Include source files in report property at its default disabled setting, the IDE still generates HTML files containing the source code and line-by-line markup for files but not functions. You can access these HTML files in the subdirectory named after the project; there just aren't any links to them in the summary page.
How to set Code Coverage preferences
- Ask to show coverage markup for files modified after the session finished
- By default, the IDE informs you when the source file you're opening in a coverage session was modified after the session finished. If the file was modified, the coverage markup will likely not match the code in some places because the coverage data is mapped to the line numbers in the code that ran during the session.
- If you uncheck this box, the IDE opens any file without advising you if it's changed and hence, the coverage markup might not be accurate.
- Show code coverage information from included files
- By default, code coverage reports don't contain coverage data from included files. You can check this box to add that data to the reports.
- Show branch coverage information
- This setting determines whether the IDE includes branch coverage information in reports by default. Specifically, it controls whether Include branch coverage in report is already checked in the dialog that opens when you select the export option for a coverage session.