![[Previous]](prev.gif) |
![[Contents]](contents.gif) |
![[Index]](keyword_index.gif) |
![[Next]](next.gif) |
|
|
|
|
 |
This version of this document is no longer maintained. For the latest documentation, see http://www.qnx.com/developers/docs. |
You can select a topic from this diagram:
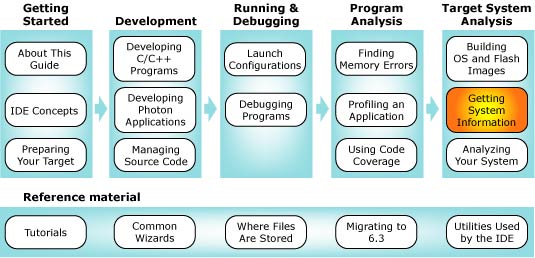
This chapter shows you how to work with the System Information perspective.
The IDE provides a rich environment not only for developing and maintaining your software, but also for examining the details of your running target systems.
Within the IDE, you'll find several views whose goal is to provide answers to such questions as:
Such questions play an important role in your overall system design. The answers to these questions often lie beyond examining a single process or thread, as well as beyond the scope of a single tool, which is why a structured suite of integrated tools can prove so valuable.
The tools discussed in this chapter are designed to be mixed and matched with the rest of the IDE's development components to help you gain insight into your system and thereby develop better products.
The System Information perspective provides a complete and detailed report on your system's resource allocation and use, along with key metrics such as CPU usage, program layout, the interaction of different programs, and more:
The perspective's metrics may prove useful throughout your development cycle, from writing and debugging your code through your quality-control strategy.
Before we describe how to work with the System Information perspective, let's first briefly discuss the terms used in the perspective itself. The main items are:
Threads within a process share the same virtual memory space, but have their own stack. This common address space lets threads within the process easily access shared code and data, and lets you optimize or group common functionality, while still providing process-level protection from the rest of the system.
Each thread can have a scheduling priority ranging from 1 to 255 (the highest priority), independent of the scheduling policy. The special idle thread (in the process manager) has priority 0 and is always ready to run. A thread inherits the priority of its parent thread by default.
You can set a thread's priority using the pthread_setschedparam() function.
You can set a thread's scheduling policy using the pthread_setschedparam() function or you can start a process with a specific priority and policy by using the on -p command (see the Utilities Reference for details).
The OS supports the standard POSIX signals (as in UNIX) as well as the POSIX realtime signals. The POSIX signals interface specifies how signals target a particular process, not a specific thread. To ensure that signals go to a thread that can handle specific signals, many applications mask most signals from all but one thread.
You can specify the action associated with a signal by using the sigaction() function, and block signals by using sigprocmask(). You can send signals by using the raise() function, or send them manually using the Target Navigator view (see "Sending a signal" below).
 |
For more information on all these terms and concepts, see the QNX Neutrino Microkernel chapter in the System Architecture guide. |
You use the views in the System Information perspective for these main tasks:
| To: | Use this view: |
|---|---|
| Control your system information session. | Target Navigator view |
| Examine your target system's attributes. | System Summary |
| Watch your processes and view thread activity. | Process Information |
| Inspect virtual address space. | Memory Information |
| Track heap usage. | Malloc Information |
| Examine process signals. | Signal Information |
| Get channel information. | System Blocking Graph |
| Track file descriptors. | Connection Information |
| Track resource usage. | System Resources |
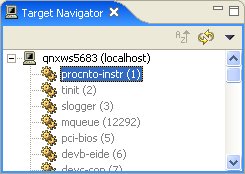
The selections you make in the Target Navigator view control the information you see in the System Information perspective:
You can customize the Target Navigator view to:
To access the Target Navigator view's customization menu,
click the menu button (![]() ) in the Target Navigator view's
title bar.
) in the Target Navigator view's
title bar.
You can reverse a selected sort order by clicking the Reverse
sort button (![]() ) in the view's title bar.
) in the view's title bar.
You can enable or disable the automatic refresh by clicking the
Automatic Refresh button (![]() ) in the view's title bar. Entries in
the Target Navigator are grey when their data is stale and
needs refreshing.
) in the view's title bar. Entries in
the Target Navigator are grey when their data is stale and
needs refreshing.
If you've disabled automatic refresh, you can refresh the Target Navigator by right-clicking and choosing Refresh from the context menu.
The Target Navigator view also lets you control the information displayed by the following views:
To control the display in the Malloc Information or Memory Information view:
 |
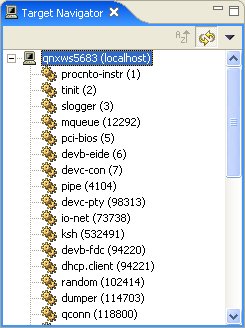
In the Target Navigator view, expand a target and select a process:
|
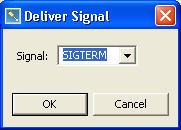
The Target Navigator view lets you send signals to the processes on your target. For example, you can terminate a process by sending it a SIGTERM signal.
To send a signal to a process:
|
Delivering a signal to a process will, in most cases, cause that process to terminate. |
To update the views in the System Information perspective:
|
In the Target Navigator view, expand a target and select a process. (You can also select groups of processes by using the Ctrl or Shift keys.) The views reflect your selection. |
The data displayed in the System Information perspective is updated automatically whenever new data is available.
By default, some views don't appear in the System Information perspective. To add a view to the perspective:
|
Some of the views associated with the System Information
perspective can add a noticeable processing load to your
host CPU. You can improve its performance by:
|
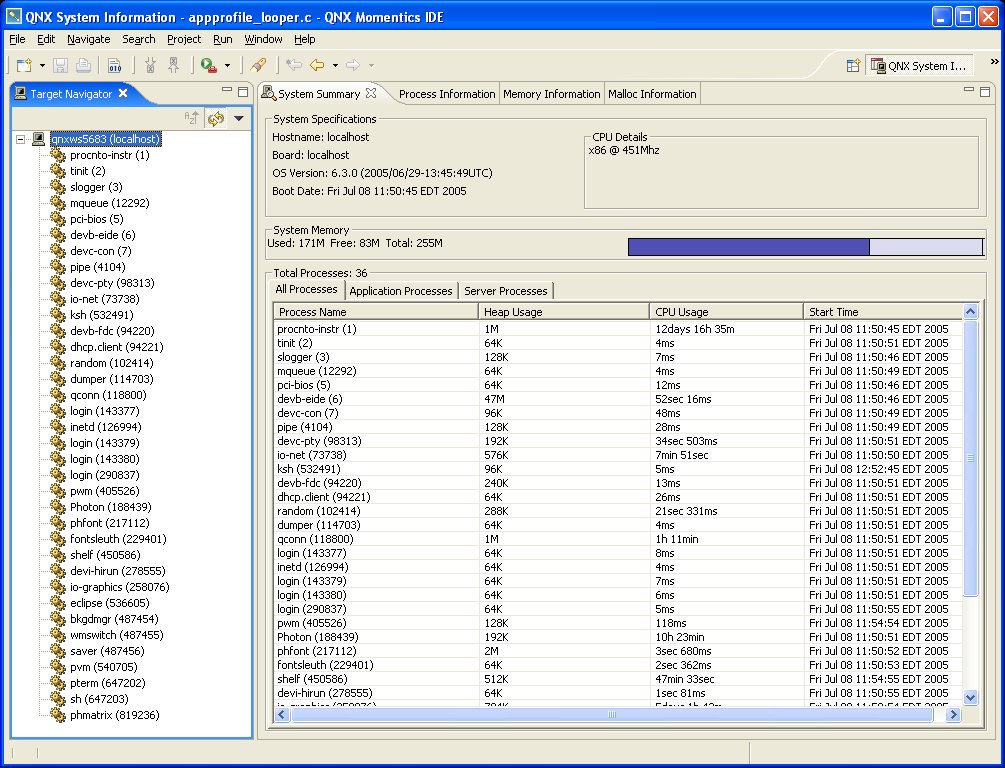
The System Summary view displays a listing of your target's system attributes, including your target's processor(s), memory, active servers, and processes:
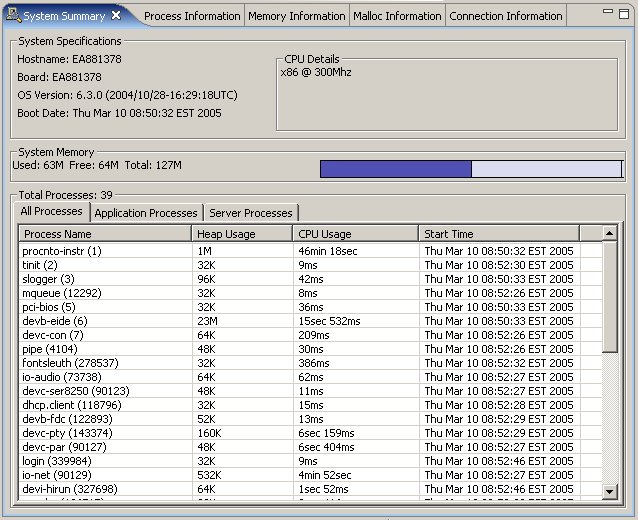
The System Summary view includes the following panes:
The System Specifications pane displays your system's hostname, board type, OS version, boot date, and CPU information. If your target is an SMP system, the pane lists CPU information for each processor.
The System Memory pane displays your system's total memory and free memory in numerical and graphical form.
The Processes panes display the process name, heap usage, CPU usage time, and start time for the processes running on your selected target. The panes lets you see application processes, server processes, or both. Server processes have a session ID of 1; application processes have a session ID greater than 1.
The Process Information view displays information about the processes you select in the Target Navigator view. The view shows the name of the process, its arguments, environment variables, and so on. The view also shows the threads in the process and the states of each thread:
The Process Information view includes the following panes:
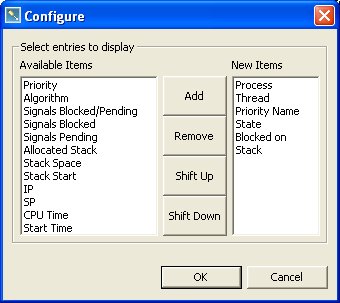
The Thread Details pane shows information about your selected process's threads, including the thread's ID, priority, scheduling policy, state, and stack usage.
The Thread Details pane lets you display a substantial amount of information about your threads, but some of the column entries aren't shown by default.
To configure the information displayed in the Thread Details pane:
The Environment Variables pane provides the values of the environment variables that are set for your selected process. (For more information, see the Commonly Used Environment Variables appendix in the Utilities Reference.
The Process Properties pane shows the process's startup arguments, and the values of the process's IDs: real user, effective user, real group, and effective group.
The process arguments are the arguments that were used to start your selected process as they were passed to your process, but not necessarily as you typed them. For example, if you type ws *.c, the pane might show ws cursor.c io.c my.c phditto.c swaprelay.c, since the shell expands the *.c before launching the program.
The process ID values determine which permissions are used for your program. For example, if you start a process as root, but use the seteuid() and setegid() functions to run the program as the user jsmith, the program runs with jsmith's permissions. By default, all programs launched from the IDE run as root.
Two views in the QNX System Information perspective are especially useful for examining the memory of your target system:
The Malloc Information view displays statistical information from the general-purpose, process-level memory allocator:
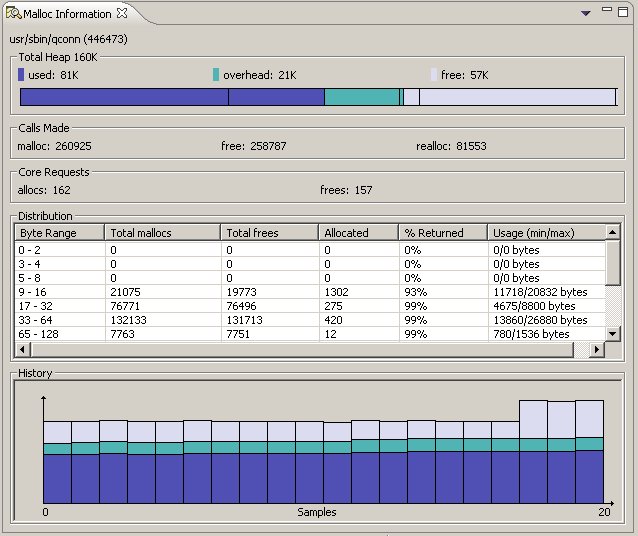
When you select a process in the Target Navigator view, the IDE queries the target system and retrieves the allocator's statistics. The IDE gathers statistics for the number of bytes that are allocated, in use, and overhead.
The view includes the following panes:
The Total Heap pane shows your total heap memory, which is the sum of the following states of memory:
The bar chart shows the relative size of each.
The Calls Made pane shows the number of times a process has allocated, freed, or reallocated memory by calling malloc(), free(), and realloc() functions. (See the Library Reference.)
The Core Requests pane displays the number of allocations that the system allocator automatically made to accommodate the needs of the program you selected in the Target Navigator view. The system allocator typically dispenses memory in increments of 4K (one page).
The number of allocations will never equal the number of deallocations, because when the program starts, it allocates memory that isn't released until it terminates.
The Distribution pane shows a distribution of the memory allocation sizes. The pane includes the following columns:
The History pane shows a chronology of the heap usage shown in the Total Heap pane. The pane automatically rescales as the selected process increases its total heap.
The History pane updates the data every second, with a granularity of 1K. Thus, two 512-byte allocations made over several seconds trigger one update.
|
You can choose to hide or display the Distribution and History panes:
|
The Memory Information view displays the memory used by the process you select in the Target Navigator view:
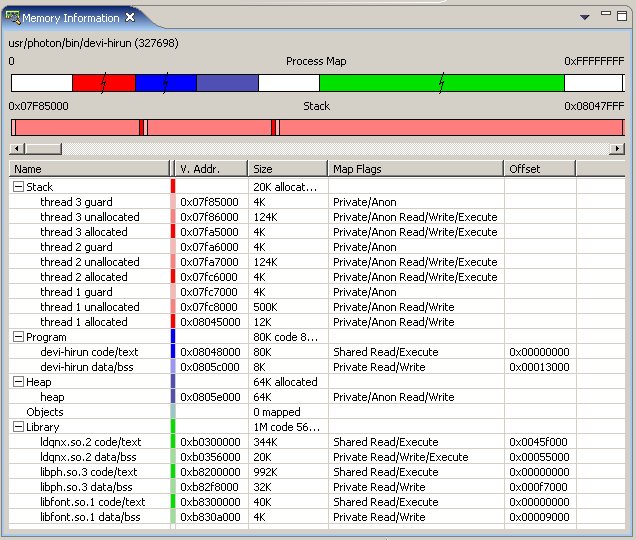
The view shows the following major categories of memory usage:
The Process Memory pane shows the overall memory usage. To keep large sections of memory from visually overwhelming smaller sections, the view scales the display semilogarithmically and indicates compressed sections with a split.
Below the Process Memory pane, the Process Memory subpane shows your selected memory category (e.g. Stack, Library) linearly. The subpane colors the memory by subcategory (e.g. a stack's guard page), and shows unused memory.
The Memory Information view's table lists all the memory segments and the associated virtual address, size, permissions, and offset. The major categories list the total sizes for the subcategories (e.g. Library lists the sizes for code/data in the Size column). The Process Memory pane and subpane update their displays as you make selections in the table.
The Memory Information view's table includes the following columns:
To toggle the Memory Information view's table arrangement between a flat list and a categorized list:
|
Select the dropdown menu ( |
Stack errors can occur if your program contains functions that are deeply recursive or use a significant amount of local data. Errors of this sort can be difficult to find using conventional testing; although your program seems to work properly during testing, the system could fail in the field, likely when your system is busiest and is needed the most.
The Memory Information view lets you see how much stack memory your program and its threads use. The view can warn you of potential stack errors.
Your program can experience problems if it uses the heap inefficiently. Memory-allocation operations are expensive, so your program may run slowly if it repeatedly allocates and frees memory, or continuously reallocates memory in small chunks.
The Malloc Information view displays a count of your program's memory allocations; if your program has an unusually high turnover rate, this might mean that the program is allocating and freeing more memory than it should.
You may also find that your program uses a surprising amount of memory, even though you were careful not to allocate more memory than you required. Programs that make many small allocations can incur substantial overhead.
The Malloc Information view lets you see the amount of overhead memory the malloc library uses to manage your program's heap. If the overhead is substantial, you can review the data structures and algorithms used by your program, and then make adjustments so that your program uses its memory resources more efficiently. The Malloc Information view lets you track your program's reduction in overall memory usage.
|
To learn more about the common causes of memory problems, see Heap Analysis: Making Memory Errors a Thing of the Past in the QNX Neutrino Programmer's Guide. |
The Signal Information view shows the signals for the processes selected in the Target Navigator view.
The view shows signals that are:
You can send a signal to any process by using the Target Navigator view (see the section "Sending a signal" in this chapter.)
The System Blocking Graph view presents a color-coded display of all the active channels in the system and illustrates the interaction of threads with those channels.
Interaction with resource objects are such that a thread can be blocked waiting for access to the resource or waiting for servicing (i.e. the thread is SEND-blocked on a channel).
The thread could also be blocked waiting for a resource to be released back to the thread or waiting for servicing to terminate (i.e. the thread is REPLY-blocked).
Clients in such conditions are shown on the left side of the graph, and the resource under examination is in the middle. Threads that are waiting to service a request or are active owners of a resource, or are actively servicing a request, are displayed on the right side of the graph:
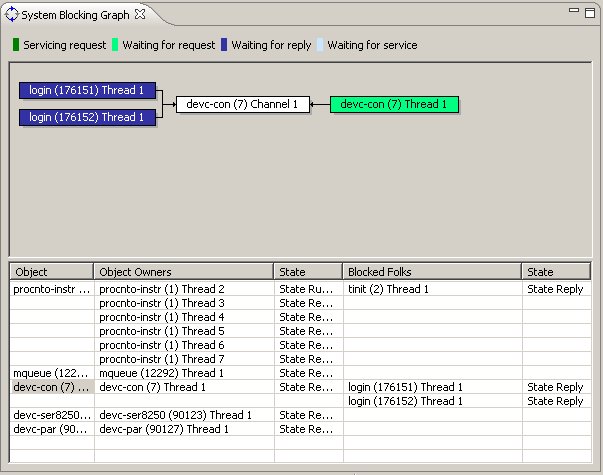
In terms of "classical" QNX terminology, you can think of the items in the legend at the top of the graph like this:
| Legend item | Thread state |
|---|---|
| Servicing request | Not RECEIVE-blocked (e.g. RUNNING, blocked on a mutex, etc.) |
| Waiting for request | RECEIVE-blocked |
| Waiting for reply | REPLY-blocked |
| Waiting for service | SEND-blocked |
The Connection Information view displays the file descriptors, server, and connection flags related to your selected process's connections. The view also shows (where applicable) the pathname of the resource that the process accesses through the connection:
The information in this view comes from the individual resource manager servers that are providing the connection. Certain resource managers may not have the ability to return all the requested information, so some fields will be left blank.
The IOFlags column describes the read (r) and write (w) status of the file. A double dash (--) indicates no read or write permission; a blank indicates that the information isn't available.
The Seek Offset column indicates the connector's offset from the start of the file.
Note that for some FDs, an "s" appears beside the number. This means that the FD in question was created via a side channel -- the connection ID is returned from a different space than file descriptors, so the ID is actually greater than any valid file descriptor.
For more information on side channels, see ConnectAttach() in the Library Reference.
To see the full side channel number:
The System Resources view shows various pieces of information about your system's processes. You can choose one of the following displays:
To select which display you want to see, click the menu
dropdown button (![]() ) in the System Resources view.
) in the System Resources view.
The System Uptime display provides information about the start time, CPU usage time, and the usage as a percent of the total uptime, for all the processes running on your selected target:
The General Resources display provides information about CPU usage, heap size, and the number of open file descriptors, for all the processes running on your selected target.
The Memory Resources display provides information about the heap, program, library, and stack usage for each process running on your selected target:
To learn more about the meaning of the values shown in the Memory Resources display, see the Finding Memory Errors chapter in this guide.
|
|
|
|