![[Previous]](prev.gif) |
![[Contents]](contents.gif) |
![[Index]](keyword_index.gif) |
![[Next]](next.gif) |
|
|
|
|
 |
This version of this document is no longer maintained. For the latest documentation, see http://www.qnx.com/developers/docs. |
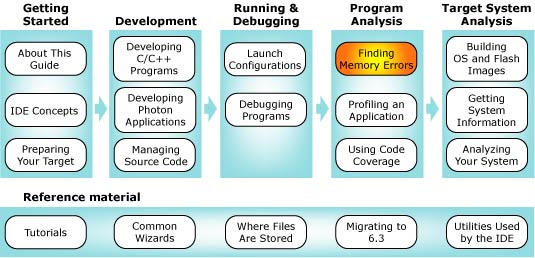
You can select a topic from this diagram:
Use the QNX Memory Analysis perspective to solve memory problems.
Have you ever had a customer say, "The program was working fine for days, then it just crashed"? If so, chances are good that your program had a memory error -- somewhere.
Debugging memory errors can be frustrating; by the time a problem appears, often by crashing your program, the corruption may already be widespread, making the source of the problem difficult to trace.
The QNX Memory Analysis perspective shows you how your program uses memory and can help ensure that your program won't cause problems. The perspective helps you quickly pinpoint memory errors in your development and testing environments before your customers get your product.
 |
The QNX Memory Analysis perspective may produce incorrect results when more than one IDE is communicating with the same target system. To use this perspective, make sure only one IDE is connected to the target system. |
By design, the architecture of the OS helps ensure that faults, including memory errors, are confined to the program that caused them. Programs are less likely to cause a cascade of faults because processes are isolated from each other and from the microkernel. Even device drivers behave like regular debuggable processes:
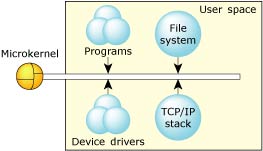
This robust architecture ensures that crashing one program has little or no effect on other programs throughout the system. When a program faults, you can be sure that the error is restricted to that process's operation.
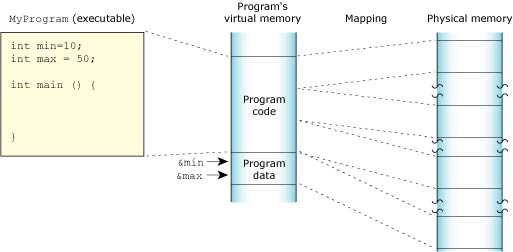
Neutrino's full memory protection means that almost all the memory addresses your program encounters are virtual addresses. The process manager maps your program's virtual memory addresses to the actual physical memory; memory that is contiguous in your program may be transparently split up in your system's physical memory:
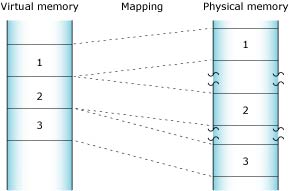
The process manager allocates memory in small pages (typically 4K each). To determine the size for your system, use the sysconf(_SC_PAGESIZE) function.
As you'll see when you use the memory-analysis tools, the IDE categorizes your program's virtual address space as follows:
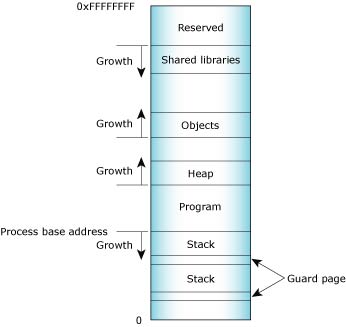
Process memory layout on an x86.
The Memory Information and Malloc Information views of the QNX System Information perspective provide detailed, live views of a process' memory. See the Getting System Information chapter for more information.
Program memory holds the executable contents of your program. The code section contains the read-only execution instructions (i.e. your actual compiled code); the data section contains all the values of the global and static variables used during your program's lifetime:
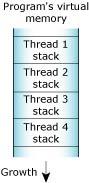
Stack memory holds the local variables and parameters your program's functions use. Each process in Neutrino contains at least the main thread; each of the process's threads has an associated stack. When the program creates a new thread, the program can either allocate the stack and pass it into the thread-creation call, or let the system allocate a default stack size and address:
When your program runs, the process manager reserves the full stack in virtual memory, but not in physical memory. Instead, the process manager requests additional blocks of physical memory only when your program actually needs more stack memory. As one function calls another, the state of the calling function is pushed onto the stack. When the function returns, the local variables and parameters are popped off the stack.
The used portion of the stack holds your thread's state information and takes up physical memory. The unused portion of the stack is initially allocated in virtual address space, but not physical memory:
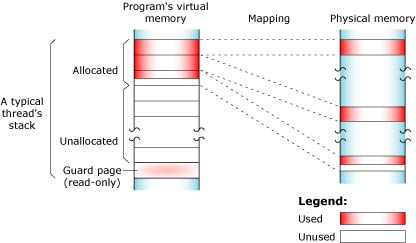
At the end of each virtual stack is a guard page that the microkernel uses to detect stack overflows. If your program writes to an address within the guard page, the microkernel detects the error and sends the process a SIGSEGV signal.
As with other types of memory, the stack memory appears to be contiguous in virtual process memory, but not necessarily so in physical memory.
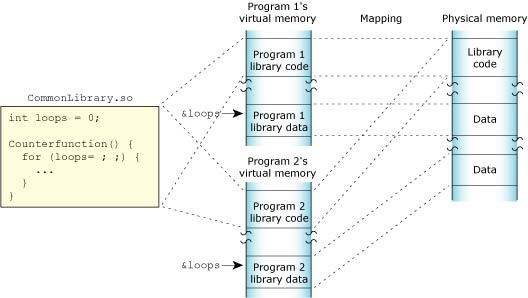
Shared-library memory stores the libraries you require for your process. Like program memory, library memory consists of both code and data sections. In the case of shared libraries, all the processes map to the same physical location for the code section and to unique locations for the data section:
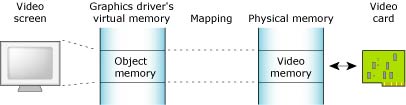
Object memory represents the areas that map into a program's virtual memory space, but this memory may be associated with a physical device. For example, the graphics driver may map the video card's memory to an area of the program's address space:
Heap memory represents the dynamic memory used by programs at runtime. Typically, processes allocate this memory using the malloc(), realloc(), and free() functions. These calls ultimately rely on the mmap() function to reserve memory that the malloc library distributes.
The process manager usually allocates memory in 4K blocks, but allocations are typically much smaller. Since it would be wasteful to use 4K of physical memory when your program wants only 17 bytes, the malloc library manages the heap. The library dispenses the paged memory in smaller chunks and keeps track of the allocated and unused portions of the page:
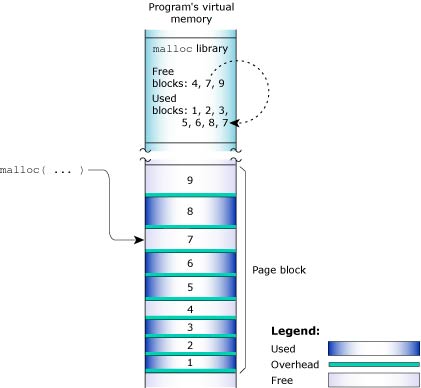
Each allocation uses a small amount of fixed overhead to store internal data structures. Since there's a fixed overhead with respect to block size, the ratio of allocator overhead to data payload will be larger for smaller allocation requests.
When your program uses the malloc() function to request a block of memory, the malloc library returns the address of an appropriately sized block. To maintain constant-time allocations, the malloc library may break some memory into fixed blocks. For example, the library may return a 20-byte block to fulfill a request for 17 bytes, a 1088-byte block for a 1088-byte request, and so on.
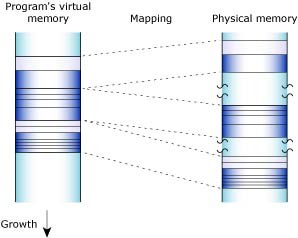
When the malloc library receives an allocation request that it can't meet with its existing heap, the library requests additional physical memory from the process manager. As your program frees memory, the library merges adjacent free blocks to form larger free blocks wherever possible. If an entire memory page becomes free as a result, the library returns that page to the system. The heap thus grows and shrinks in 4K increments:
The main system allocator has been instrumented to keep track of statistics associated with allocating and freeing memory. This lets the memory statistics module nonintrusively inspect any process's memory usage.
When you launch your program with the Memory Analysis tool, your program uses the debug version of the malloc library (libmalloc.so). Besides the normal statistics, this library also tracks the history of every allocation and deallocation, and provides cover functions for the string and memory functions (e.g. strcmp(),memcpy(),memmove()). Each cover function validates the corresponding function's arguments before using them. For example, if you allocate 16 bytes, then forget the terminating null character and attempt to copy a 16-byte string into the block using the strcpy() function, the library detects the error.
The debug version of the malloc library uses more memory than the nondebug version. When tracing all calls to malloc() and free(), the library requires additional CPU overhead to process and store the memory-trace events.
The QNX Memory Analysis perspective can help you pinpoint and solve various kinds of problems, including:
Memory leaks can occur if your program allocates memory and then forgets to free it later. Over time, your program consumes more memory than it actually needs.
In its mildest form, a memory leak means that your program uses more memory than it should. QNX Neutrino keeps track of the exact memory your program uses, so once your program terminates, the system recovers all the memory, including the lost memory.
If your program has a severe leak, or leaks slowly but never terminates, it could consume all memory, perhaps even causing certain system services to fail.
These tools in the QNX Memory Analysis perspective can help you find and fix memory leaks:
Memory errors can occur if your program tries to free the same memory twice or uses a stale or invalid pointer. These "silent" errors can cause surprising, random application crashes. The source of the error can be extremely difficult to find, because the incorrect operation could have happened in a different section of code long before an innocent operation triggered a crash.
In the event of a such an error, the IDE can stop your program's execution and let you see all the allocations that led up to the error. The Memory Problems view displays memory errors and the exact line of source code that generated each error. The Memory Trace view lets you find the prior call that accessed the same memory address, even if your program made the call days earlier.
|
To learn more about the common causes of memory problems, see Heap Analysis: Making Memory Errors a Thing of the Past in the QNX Neutrino Programmer's Guide. |
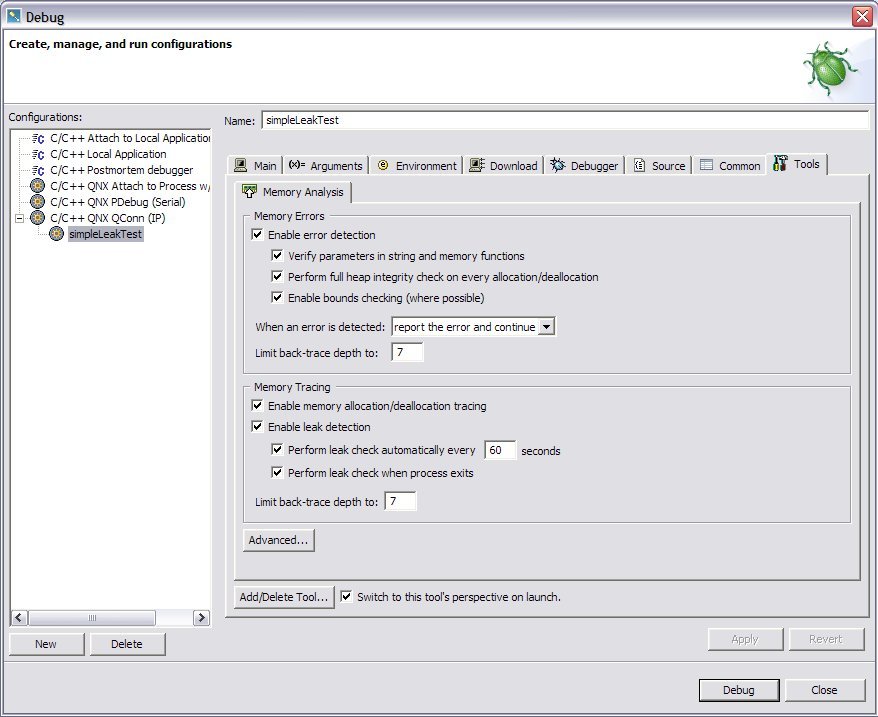
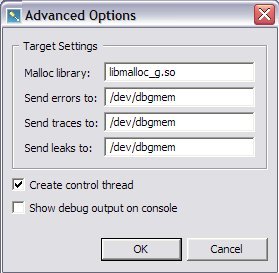
To extract the most information from your program, you should launch it with the Memory Analysis tool enabled:
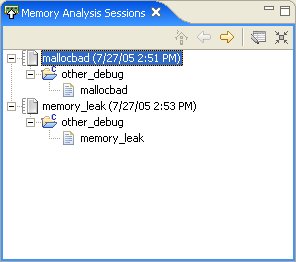
When you launch a Memory Analysis session, a new entry is made in the Memory Analysis Sessions view:
When you select an entry in the Memory Analysis Sessions view, the Memory Trace view shows the associated memory events:
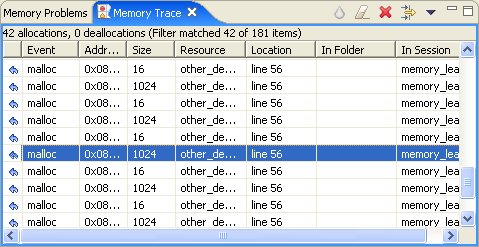
Each event includes the address of the memory block, the block size, the workbench resource and location that caused the memory event, as well as the project folder name and memory analysis session name.
Select a row in the Memory Trace view to see a backtrace of one or more function calls in the Event Backtrace view.
Double-click a row in the Memory Trace view to open that event's source file and go to the line that caused the memory event.
Select a column in the Memory Trace view to sort the data by the entries in that column.
The Memory Trace uses the following icons to indicate different types of events:
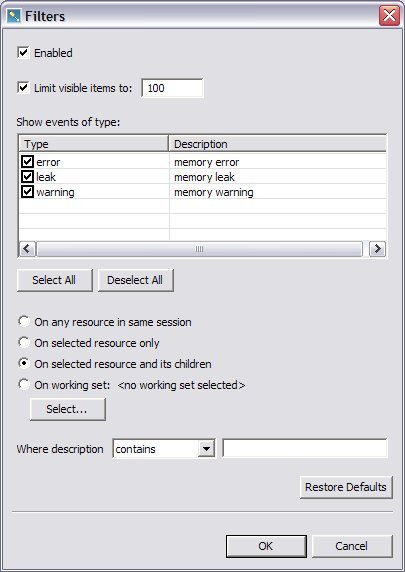
You can filter the events displayed in the Memory Trace view
by choosing Filters... from the view's menu (![]() ):
):
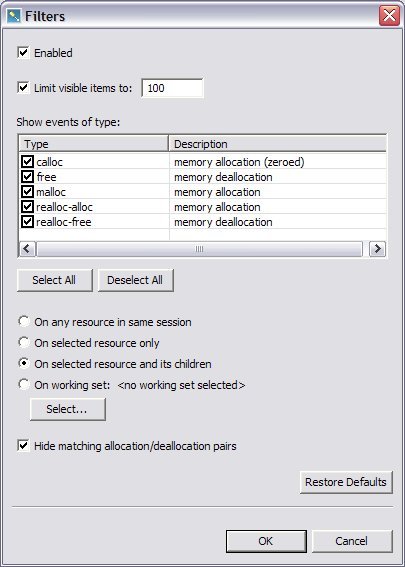
To filter memory trace events:
You can quickly select or deselect all memory events using the Select All and Deselect All buttons below the list.
You can select a working set by clicking the Select... button.
The Memory Problems view displays memory leaks, errors (such as buffer overruns), and warnings.
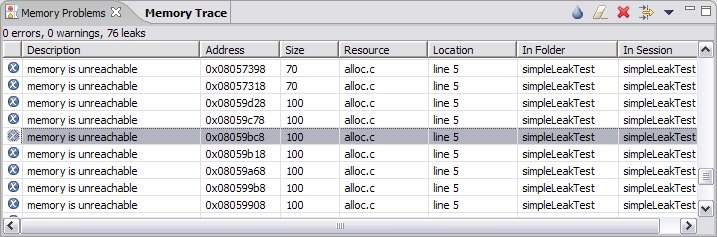
Each entry in the Memory Problems view displays a description, the memory address, size, and the source code location (resource and line number) of the memory problem.
Select a column in the Memory Problems view to sort the data by the entries in that column.
Double-click an entry to open an editor with the source code line highlighted.
You can filter the problems displayed in the Memory Problems view
by choosing Filters... from the view's menu (![]() ):
):
To filter memory problems:
You can quickly select or deselect all memory events using the Select All and Deselect All buttons below the list.
You can select a working set by clicking the Select... button.
You can search for descriptions except ones that contain the specified string by choosing does not contain from the drop-down menu.
The Event Backtrace view displays a call stack trace leading up to your selected memory event or error:
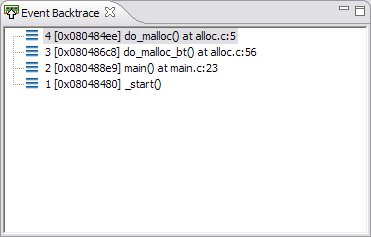
To display error information in the Event Backtrace view:
 |
Click on a memory event in the Memory Trace view. |
|
|
|
|