![[Previous]](prev.gif) |
![[Contents]](contents.gif) |
![[Index]](keyword_index.gif) |
![[Next]](next.gif) |
|
|
|
|
 |
This version of this document is no longer maintained. For the latest documentation, see http://www.qnx.com/developers/docs. |
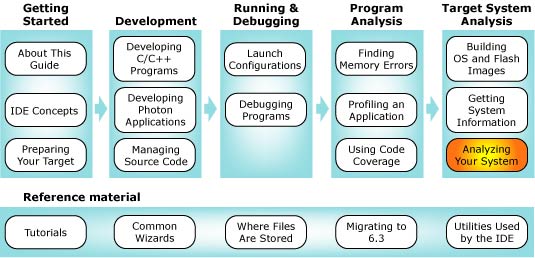
You can select a topic from this diagram:
Use the System Profiler to analyze your system via instrumentation.
The System Profiler is a tool that works in concert with the Neutrino instrumented kernel (procnto-instr) to provide insight into the operating system's events and activities. Think of the System Profiler as a system-level software logic analyzer. Like the Application Profiler, the System Profiler can help pinpoint areas that need improvement, but at a system-wide level.
The instrumented kernel can gather a variety of events, including:
You might use the System Profiler to solve such problems as:
 |
Details on kernel instrumentation (such as types and classes of events) are more fully covered in the System Analysis Toolkit (SAT) User's Guide. |
The QNX System Profiler perspective includes several components that are relevant to system profiling:
|
Statistics can be gathered for the entire log file or for a selected range. |
|
The QNX System Profiler perspective may produce incorrect results when more than one IDE is communicating with the same target system. To use this perspective, make sure only one IDE is connected to the target system. |
As mentioned earlier, in order to capture instrumentation data for analysis, the instrumented kernel (procnto-instr) must be running. This kernel is a drop-in replacement for the standard kernel (though the instrumented kernel is slightly larger). When you're not gathering instrumentation data, the instrumented kernel is almost exactly as fast as the regular kernel.
|
To know if the instrumented kernel is running, enter this
command:
ls /proc/boot If procnto-instr appears in the output, then the OS image is running the instrumented kernel. |
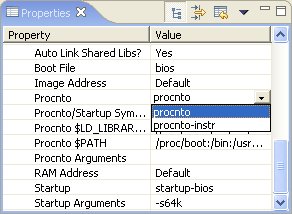
To substitute the procnto-instr module in the OS image on your board, you can either manually edit your buildfile, then run mkifs to generate a new image, or use the System Builder perspective to configure the image's properties.
Assuming you're running the instrumented kernel on your board, you're ready to use the System Profiler. A profiling session usually involves these three steps:
You can gather trace events from the instrumented kernel in two different ways. You run a command-line utility (e.g. tracelogger) on your target to generate a log file, and then transfer that log file back to your development environment for analysis. Or, you can capture events directly from the IDE using the Trace Events Configuration wizard.
|
In order to get timing information from the kernel, you need
to run tracelogger as the root user.
If you gather system profiling data through qconn in the IDE, you're already accessing the instrumented kernel as root. |
Using the command-line server currently offers more flexibility as to when the data is captured, but requires that you set up and configure filters yourself using the TraceEvent() API. The Trace Events Configuration wizard lets you set a variety of different static filters and configure the duration of time that the events will be logged for.
For more information on the tracelogger utility, see its entry in the Utilities Reference. For TraceEvent(), see the Library Reference.
 |
In the Target Navigator view, right-click a target, then select
Kernel Events Tracing... from the menu.
If you don't have the Target Navigator view open, choose Window-->Show View-->Other..., then QNX Targets-->Target Navigator. |
|
If you don't already have a target project, you'll have to
create one:
You can use this target project for a number of different tasks (debugging, memory analysis, profiling), so once you create it, you won't have to worry about connecting to your target again. Note also that the qconn target agent must be running on your target machine. |
The wizard takes you through the process of selecting:
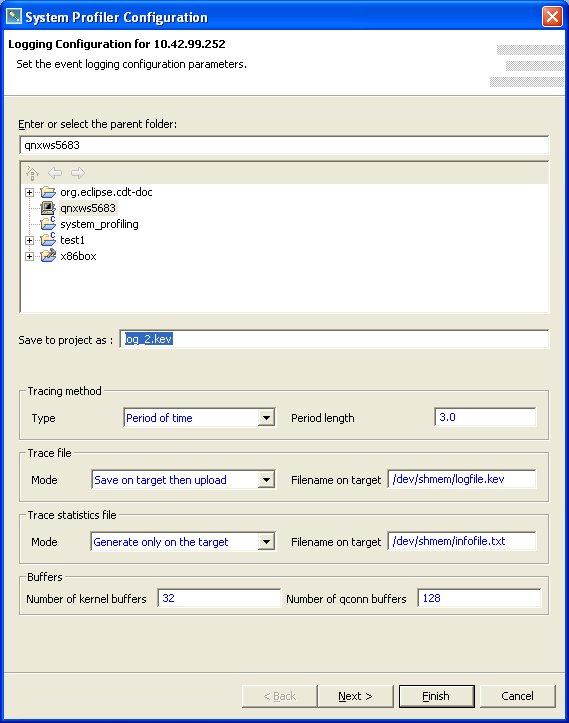
Here are the main fields in this wizard:
|
If your target is running QNX 6.2.1, you must use this option instead of "Generate only on the target" because the trace statistics file is not supported under QNX 6.2.1. |
Regardless of how your log file is captured, you have a number of different options for how to regulate the amount of information actually captured:
(For more information, see the SAT User's Guide.)
The IDE lets you access the first three of the above filters. You can enable tracing (currently done by activating the tracing wizard), and then select what kind of data is logged for various events in the system.
The events in the system are organized into different classes (kernel calls, communication, thread states, interrupts, etc). You can toggle each of these classes in order to indicate whether or not you want to generate such events for logging.
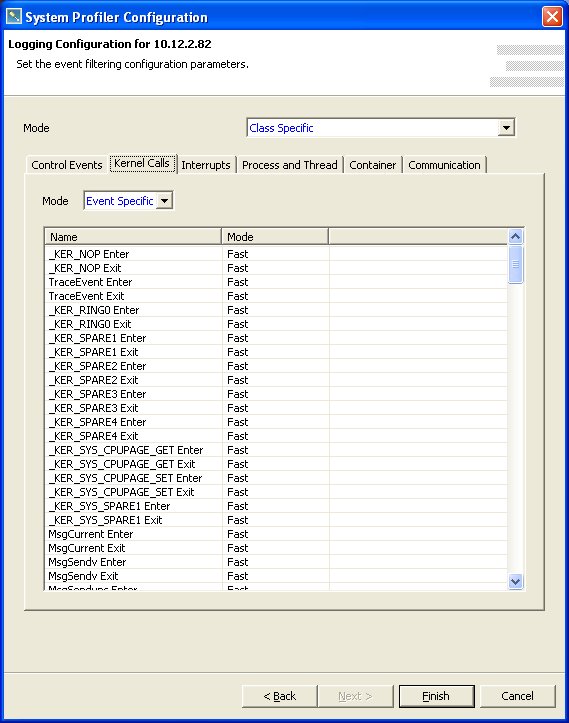
The data logged with events comes in the following modes:
Choosing Event Specific lets you select Disable, Fast, or Wide for each event in that class.
Depending on the purpose of the trace, you'll want to selectively enable different tracing modes for different types of events so as to minimize the impact on the overall system. For its part in the analysis of these events, the IDE will do its best to work with whatever data is present. (But note that some functionality may not be available for post-capture analysis if it isn't present in the raw event log. ;-))
Once an event file is generated and transferred back to the development host for analysis (whether it was done automatically by the IDE or generated by using tracelogger and manually extracted back to the IDE), you can then invoke the System Profiler editor.
|
If you receive a "Could not find target: Read timed out."
error while capturing data, it's possible that a CPU-intensive program
running at a priority the same as or higher than qconn is
preventing qconn from transferring data back to the host
system.
If this happens, restart qconn with the qconn_prio= option to specify a higher priority. You can use hogs or pidin to see which process is keeping the target busy, and discover its priority. |
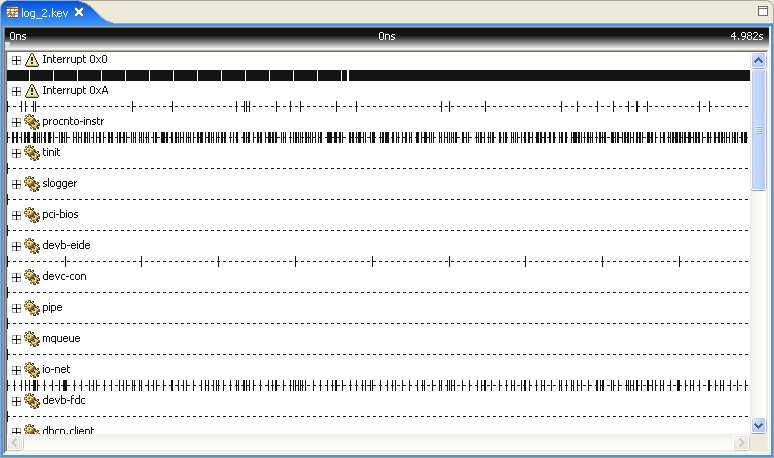
The IDE includes a custom perspective for working with the System Profiler. This perspective sets up some of the more relevant views for easy access.
In order to start examining an event file, the easiest way is to name it with a .kev (kernel event) extension. Files with this extension are automatically bound to the System Profiler editor.
The System Profiler editor is the center of all of the analysis activity. It provides different visualization options for the event data in the log files:
The Timeline presentation is the default. To choose one of the other types, right-click in the editor, then select Display-->Toggle. Then choose one of:
For displays other than the Timeline, you can display the data using your choice of graph by right-clicking the graph and choosing Graph Type. Select one of the graph types from the list:
3D versions of the graphs are also available, with the exception of the Pie Chart which has no 3D version.
Each of these visualizations is available as a "pane" in a stack of "panes." Additionally, the visualization panes can be split -- you can look at the different sections of the same log file and do comparative analysis.
All panes of the same stack share the same display information. A new pane inherits the display information of the previous pane, but becomes independent after it's created.
To split the display, right-click in the editor, then select Display-->Split. Note that you can lock two panes to each other. From the Split sub-menu, choose the graph you want to display in the new pane:
|
You can have a maximum of four panes. |
A number of different features are available from within the editor:
If an owner has children (e.g. a parent process with threads), you'll see an plus sign beside the parent's name. To see a parent's children, click the plus sign (or press Shift-E to expand all owners, and Shift-C to collapse).
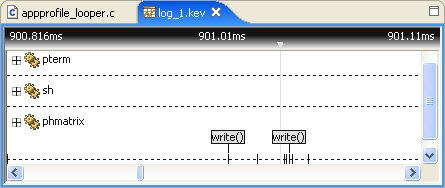
For example, to view only processes that are sending pulses, right-click in the timeline, then select Event Owner Filters-->Show Only-->MsgSend Family.
These bookmarks show up in the Bookmarks view and can represent a range of time or a single particular event instance.
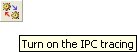
You can toggle IPC tracing on/off by pressing I or clicking this button in the toolbar:
Within the editor, you can select either of the following:
To select a single element, simply click the element's name. To unselect an element, press and hold the Ctrl key, then click each selected element's name.
To select multiple elements, press and hold the Ctrl key, then click each element's name.
To select a point in time, click an element on the timeline.
To select a range, click the start point on the timeline, then drag and release at the end point.
Or, select the start point, then hold down the Shift key and select the end point.
When zooming in, the display will center the selection. If a time-range selection is smaller than the current display, the display will adjust to the range selection (or by a factor of two).
When zooming out, the display will center the selection and adjust by a factor of two.
When using a preset zoom factor (100% to 0.01%), the display will center the current selection and adjust to the new factor.
There are various ways to zoom:
You use these keys to scroll through time:
| To move: | Use this key: |
|---|---|
| The selection to the left by one event. | <-- |
| The selection to the right by one event. | --> |
| The display to the right by one page (horizontal scrollbar thumb size). | Shift---> |
| The display to the left by one page (horizontal scrollbar thumb size). | Shift-<-- |
| The display to the beginning of the timeline. | Shift-Home |
| The display to the end of the timeline. | Shift-End |
You use these keys to scroll through elements:
| To move the display: | Use this key: |
|---|---|
| Up by one element. | /\ |
| Down by one element. | \/ |
| Up by one page (horizontal scrollbar thumb size). | Page Up |
| Down by one page (horizontal scrollbar thumb size). | Page Down |
| To the top of the element list. | Home |
| To the bottom of the element list. | End |
When you pause your mouse pointer over an element or an event, you'll see relevant information (e.g. PID, timestamps, etc.).
There are a number of additional components outside of the editor that you can use to examine the event data in more detail:
You can define conditions, which may include regular expressions for matching particular event data content (e.g. all MsgSend events whose calling function corresponds to mmap()). You can then evaluate these conditions and place annotations directly into the System Profiler editor. The results are shown in the Search view.
Unlike the other search panels in the IDE, the Trace Search panel can search for events only in the currently active System Profiler editor. You use this search panel to build conditions and then combine them into an expression. A search will iterate through the events from the active log file and be applied against the expression; "hits" appear in the Search Results view and are highlighted in the System Profiler editor.
By default, the Trace Search panel will return up to 1000 hits. You can change this maximum on the QNX-->System Profiler of the Preferences dialog (Window-->Preferences).
|
You'll need to click the Refresh button ( |
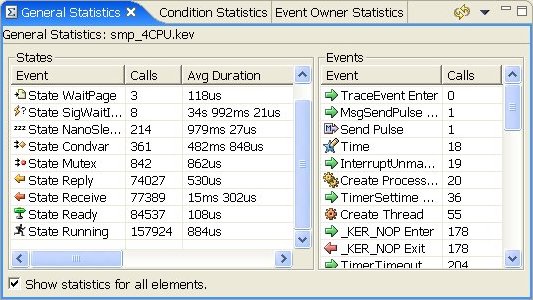
Here's an example of the General Statistics view:
|
|
|
|