Thread Call Stack
In this view, you can examine the thread call stacks for a particular time point in the trace.
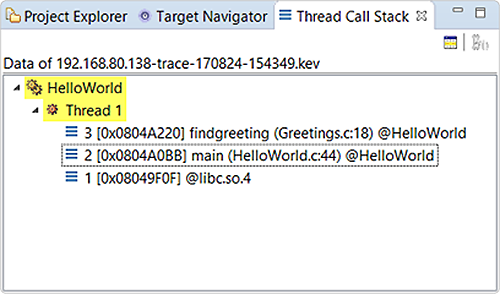
Examining call stacks is useful for seeing when an application's functions were executed relative to other system events. When you click an event in the Timeline pane or the Trace Event Log view, the IDE populates the Thread Call Stack view with the call sequences for all instrumented threads that were active at the time of the selected event. You can double-click a call stack entry to open the associated source file at the corresponding line of code.
If you don't see source file and function names and line numbers in the stack entries, it means address translation isn't
properly configured. Information about enabling and using this trace feature is given in the
Address Translation
subsection of the
kernel log configuration reference. When address translation is disabled, the view shows only virtual addresses.
- Synchronize with editor filters
(
 ) —
Updates the data display based on the current filtering settings.
) —
Updates the data display based on the current filtering settings. - Export to application profiler session
(
 ) —
Takes the data from the open kernel event log (.kev) file and exports it to an
Application Profiler session.
) —
Takes the data from the open kernel event log (.kev) file and exports it to an
Application Profiler session.