Event Data
This view displays the data for an event selected in another System Profiler view such as Trace Event Log or even the results in Search.
The Event Data view is shown in the bottom left corner instead of in the area below the editor
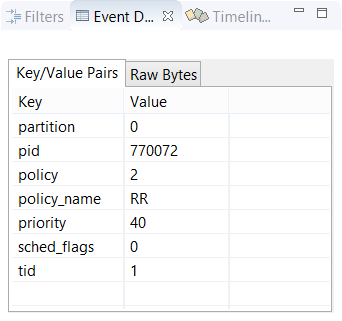
like most profiling-related views. There are two tabs:
- Key/Value Pairs — Lists the names and values of individual event data fields
- Raw Bytes — Displays the individual data bytes, in hexadecimal format
In the table, you can select one row (by left-clicking) or many rows (by holding Ctrl and Shift while clicking) and then copy the data to the clipboard, by right-clicking and choosing Copy. This is handy for saving specific event data outside of the IDE.
Page updated: