Process Information
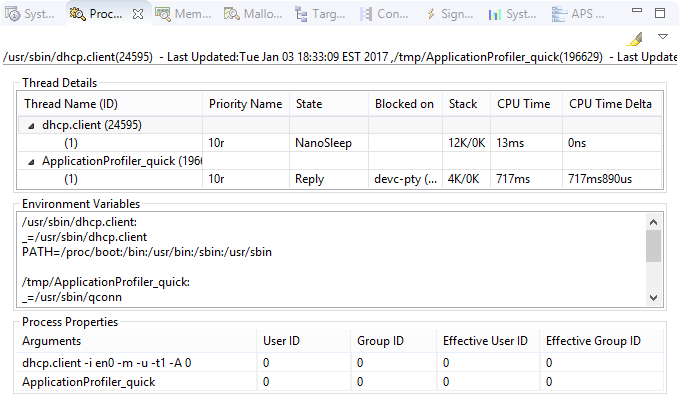
The Process Information view provides runtime details about processes and threads. For this view, information is shown for each process selected in the Target Navigator.

Thread Details
This top pane displays thread details in a table. For each process, its binary name and PID is given in one row
and its threads and their properties are listed in the rows underneath.
You can toggle the display of a process's threads by clicking the arrowhead next to its name.
This lets you filter the table to see only some threads. If you don't want to see any process rows, click the dropdown
button (![]() )
in the upper right corner of the view, then click Tree View, to deselect the grouping by process
feature.
)
in the upper right corner of the view, then click Tree View, to deselect the grouping by process
feature.
- Thread Name (ID)
- Priority Name
- State
- Blocked on
- Stack
- CPU Time
- CPU Time Delta
You can sort the thread list by any displayed metric, by clicking the corresponding column header.
To easily spot changed values, click the highlight button
(![]() ) in
the upper right toolbar of the view. The view then colors in the cells containing any values that changed since the
last update. You can change the highlight color in the System Information preferences, by selecting
.
) in
the upper right toolbar of the view. The view then colors in the cells containing any values that changed since the
last update. You can change the highlight color in the System Information preferences, by selecting
.

If you right-click a process row in the table, you see menu options for interacting with processes. These are the same options shown in the Target Navigator menu. If you right-click a thread row, you see similar options, except that you can't slay a thread or deliver a signal to it. Also, in addition to setting the priority and the inherited and non-inherited processor affinities, you can set the thread name.
Environment Variables
The environment variable settings for each process are listed in this pane.
For information about environment variables used on QNX targets, see the
Commonly Used Environment Variables
section in the Utilities Reference.
Process Properties
This bottom pane lists each process's command line, including arguments, and its real and effective user and group IDs.
The arguments listed are the ones used to start a process, which means they're what was passed to the executable binary, not necessarily what you might have entered on the command line. For example, if you entered wc *.c, the pane might show wc cursor.c io.c my.c phditto.c swaprelay.c because the shell expands the *.c token before launching the program.
The user and group IDs determine which permissions are used for a process. Suppose you start a process as root but use seteuid() and setegid() to run the program as the user jsmith. The program then runs with the permissions of jsmith. By default, all programs launched from the IDE run as root.
