Monitoring performance of threads
The Process Information view displays performance data for threads belonging to the processes selected in the Target Navigator. These data include CPU times, so you can see which threads are consuming the most processor cycles.
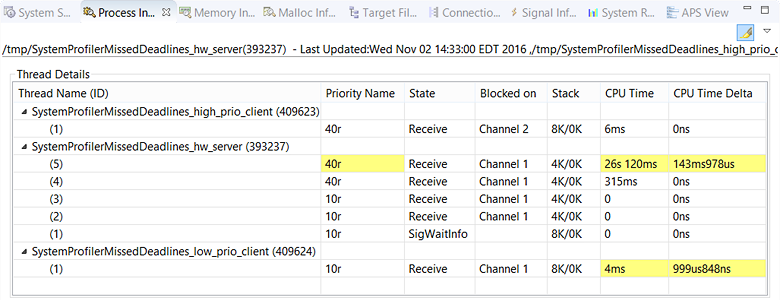
This example shows statistics from three processes—a multi-threaded server and two single-threaded clients.
The highlight option (![]() ) is enabled, so we can easily spot changed values.
In this case, thread number 5 is currently the busiest server thread, as seen by its changed CPU time values.
Meanwhile, the lower
priority client has been the more active of the clients since the last update because its CPU time values have also changed.
) is enabled, so we can easily spot changed values.
In this case, thread number 5 is currently the busiest server thread, as seen by its changed CPU time values.
Meanwhile, the lower
priority client has been the more active of the clients since the last update because its CPU time values have also changed.
You can adjust which statistics are displayed through the dropdown control (![]() ) in the upper right corner; further details are given in the
Process Information reference.
) in the upper right corner; further details are given in the
Process Information reference.