Analyzing heap memory usage with System Information and the debugger
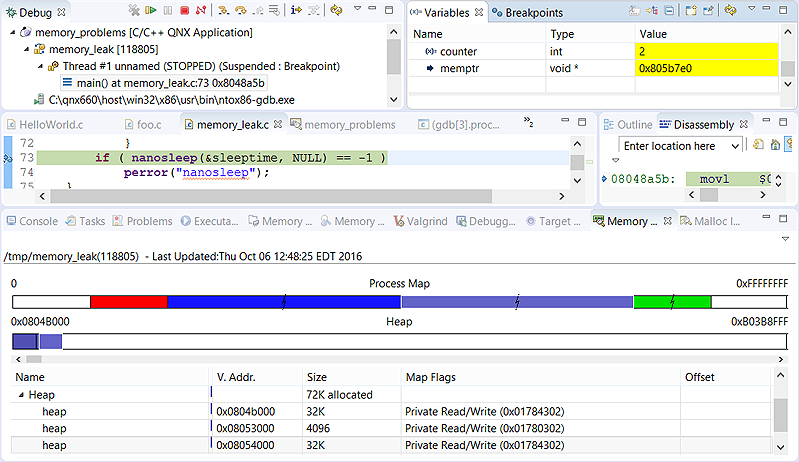
The QNX System Information perspective displays details about a process's memory, including heap segments. These details let you observe how the heap usage changes as you interact with an application or you move between breakpoints with the debugger.
When an application is running, you can select one of its processes in the Target Navigator and examine
that process's memory distribution in the
Memory Information view.
If you want to know which areas of code allocate a lot of heap memory, you can add breakpoints at strategic places
(see the Using breakpoints, watchpoints, and breakpoint actions
entry in the C/C++ Development User Guide
for information on doing so), then run the application with the debugger.