Finding memory leaks with Memory Analysis
The librcheck library tracks all memory operations and references, which lets it detect leaked blocks. Memory Analysis can request leak checks from librcheck at regular intervals and at program exit time.
- In the launch bar, expand the Launch Configuration dropdown (which is in the middle) and select the project in which you want to check for leaks.
- In the Launch Target dropdown (on the right), select the target for running your application.
-
In the Launch Mode dropdown (on the left), select Check.
Note:Although you can select Debug mode and manually enable Memory Analysis in the launch configuration, we recommend that you don't run this tool at the same time as the GDB debugger because the setup is more complicated. If you absolutely have to run both tools concurrently, you must follow the steps given in
Running Memory Analysis and the GDB Debugger concurrently
instead of the remaining steps given here. - Optional:
To confirm that Memory Analysis is the active tool or to adjust how it checks for memory leaks,
you must examine the launch configuration. To do this:
-
Click the Edit button (
 ) on the right of the Launch Configuration dropdown.
- In the configuration editor window, click the Check tab on the right to access the tool controls.
- Ensure that the Memory Analysis radio button is selected. In the fields underneath, you can enable memory leak checks and set their frequency.
- Click OK to save the configuration changes and close the window.
-
Click the Edit button (
-
In the launch bar, click the Check button
(
 ).
).
The IDE switches to the QNX Analysis perspective. If necessary, it first builds the binary. Then, the IDE uploads the binary and starts running it on the target, with librcheck loaded. When this happens, a new session is created for storing the data produced by the librcheck library; this session is displayed in the Analysis Sessions view.
The Memory Analysis tool lists leaks and other memory errors in the Memory Problems view and memory management operations in the Memory Events view, which are displayed at the bottom. By default, heap activity for the entire program is listed but you can expand the Analysis Sessions entry and click a program component (e.g., process, thread) to show only its errors and operations.
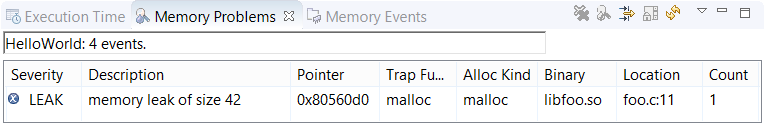
For shared libraries, you should see location information for lost blocks allocated in their functions. If you don't see this information, you must manually define the library paths.
You can click a leak to see the stack trace of the memory allocation point.
This stack trace is shown in the Memory Backtrace view displayed in the lower left area.
The depth of the allocated
call chain is restricted by the Limit back-trace depth to field
in the Memory Tracing controls.
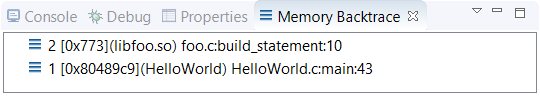
If you double-click a leak in Memory Problems or a stack frame in Memory Backtrace, the IDE opens the source file at the indicated line (assuming the backtrace depth is greater than 0). This feature lets you quickly find where a particular memory block was allocated.
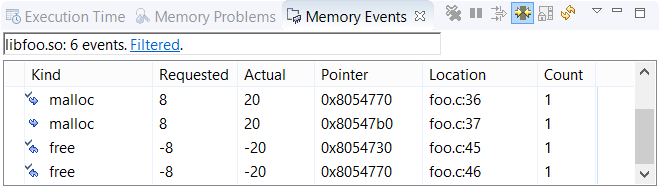
In the Kind column, the arrow icon next to the function name points either right (for allocations) or left (for deallocations). When the icon has a checkmark, there's a matching request. Thus, malloc events without a checkmark may indicate leaks. Depending on your program's design or behavior, many of these items might be not explicit but rather implicit leaks. The Memory Analysis reference explains all event fields.
Above the events list is a summary field that lists the name of the selected component, the number of events, and a link with the text Filtered. Clicking this link opens the Memory Events Filter, in which you can choose to hide all events related to blocks for which there are matching allocations and deallocations. This feature lets you filter out all non-leak events.