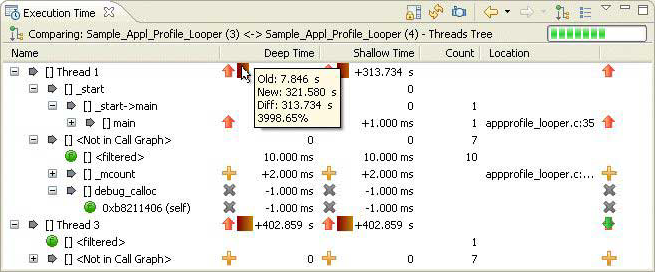
The Execution Time view's comparison feature calculates and displays the differences in function runtimes and other metrics between different sessions.
After you select two sessions and compare them,
the Deep Time, Shallow Time, and Count columns
show the profiling measurement changes from the older to the newer session (i.e., the new values minus the old ones).
If a function ran in only one session, its values from that session are displayed.
 —
Function runtime has decreased.
—
Function runtime has decreased. —
Function runtime has increased.
—
Function runtime has increased. —
Function was called in first session only.
—
Function was called in first session only. —
Function was called in second session only.
—
Function was called in second session only.
You can remove insignificant results (e.g., less than 1% difference), by opening the Filters dialog and setting the Filter elements with time value less than (%) field.
If you hover the pointer in a Deep Time or Shallow Time column,
the IDE displays a tooltip message with the old and new time values as well as their absolute and relative differences: