This view displays the results of profiling sessions so you can quickly learn which functions consume the most CPU time.
The results are presented in a table in which each row provides statistics for one function:
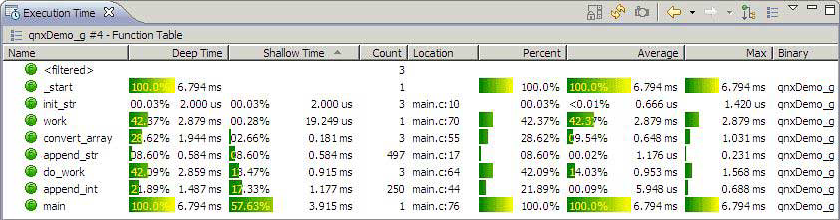
- Name
- The name of the function. The function's share of the thread's total execution time and its parent's name can also be shown, depending on the preference settings, as explained below.
- Deep Time
- The time it took to execute the
function and all of its descendants. This metric is also referred to as
Total Function Time. It is the pure realtime interval from when the
function started until it ended, which includes its shallow time, the
sum of its children's deep times, and all time in which the thread
wasn't running while blocked inside of it. If the function was called
more than once, this column contains the sum of all runtimes when it
was called from a particular stack frame or parent function.
Inside each column entry, on the left, a green bar and percentage value indicate the relative execution time. On the right, another value indicates the absolute execution time.
For Sampling mode, this column isn't used.
- Shallow Time
- For Function Instrumentation
mode, this column is the deep time minus the sum of its children's
runtimes. It roughly represents the time spent in this function only.
However, it also includes the time for kernel and instrumented library
calls and for profiling the code.
For Sampling mode, it's an estimated time, calculated by multiplying an interval time by the count of all samples from this function.
The column entries have a green bar overlaid with relative and absolute execution times, which provide similar information as in the Deep Time column.
- Count
- The number of times the function was called.
- Location
- The location in the code where the function can be found.
- Binary
- The filename for the binary.
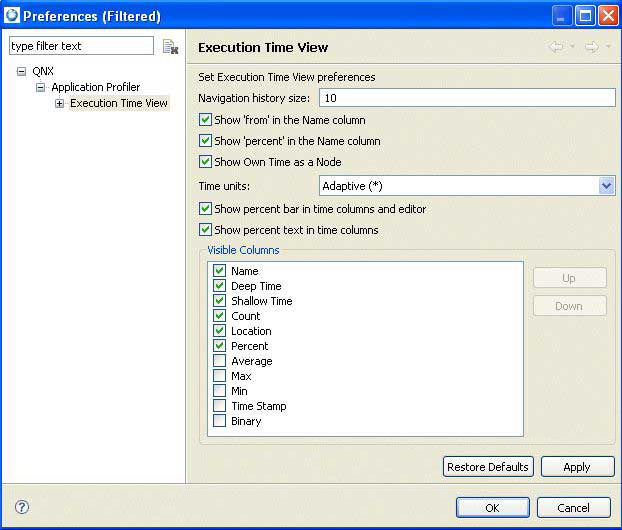
You can show additional columns or remove default ones through the Preferences dialog,
which you can access by clicking the View Menu icon
(![]() ) in the toolbar and choosing Preferences.
The dialog lets you choose which columns are visible, set the navigation history size, set the details shown
in the Name column, toggle the display of the green bars and time values, and change the time units:
) in the toolbar and choosing Preferences.
The dialog lets you choose which columns are visible, set the navigation history size, set the details shown
in the Name column, toggle the display of the green bars and time values, and change the time units:
- Percent
- The percentage of Deep Time compared to the total time of the root node (i.e., the thread).
- Average
- The average time spent in the function.
- Max
- The maximum time spent in the function.
- Min
- The minimum time spent in the function.
- Time Stamp
- A time stamp assigned to the function; this represents the last time the function was called.
Toolbar actions
- Disable Automatic Refresh (
 ) —
Pause the data display in its current state until you unlock it.
) —
Pause the data display in its current state until you unlock it. - Refresh (
 ) — Refresh the data display.
- Take Snapshot and Watch Difference (
- Show Threads Tree (Note: Information about individual threads is not available for postmortem profiling. Instead, only one thread (with all time assigned to it) is displayed.
- Show Table (