Interacting with GDB

The IDE lets you use a subset of the commands that the gdb utility offers.

To learn more about the gdb utility, see its entry in the QNX Neutrino Utilities Reference and the "Using GDB" section of the Programmer's Guide.

Enabling the QNX GDB Console view

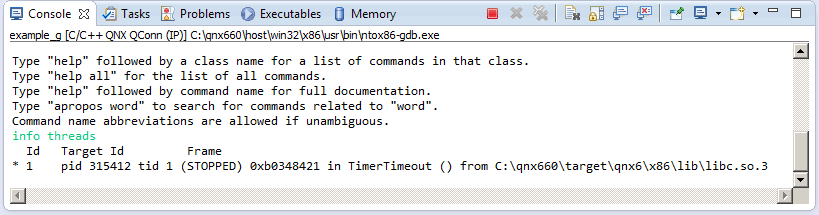
The QNX GDB Console view is part of the Console perspective. It appears as soon as data is sent to it.

To switch to the QNX GDB Console view:
  1. In the Debug view, select a debug session.
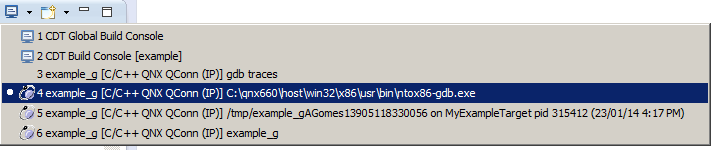
  2. Click the arrow beside the Display Selected Console button ().
  3. Choose the console whose name includes gdb.

Using the QNX GDB Console view

The QNX GDB Console view lets you bypass the IDE and talk directly to GDB; the IDE is unaware of anything done in this view. Items such as breakpoints that you set from the QNX GDB Console view don't appear in the C/C++ editor.

Also, you can't use the Tab key for line completion because the commands are sent to GDB only when you press Enter.

To use the QNX GDB Console view, in this view, enter a command (e.g., nexti to step one instruction).

Figure 1. The Console view: using with GDB
Note: To enter commands, you must be on the last line of the Console view.