The Memory Information view provides insight into the memory allocation patterns for a process.
Specifically, it displays a memory distribution map and information about each segment.
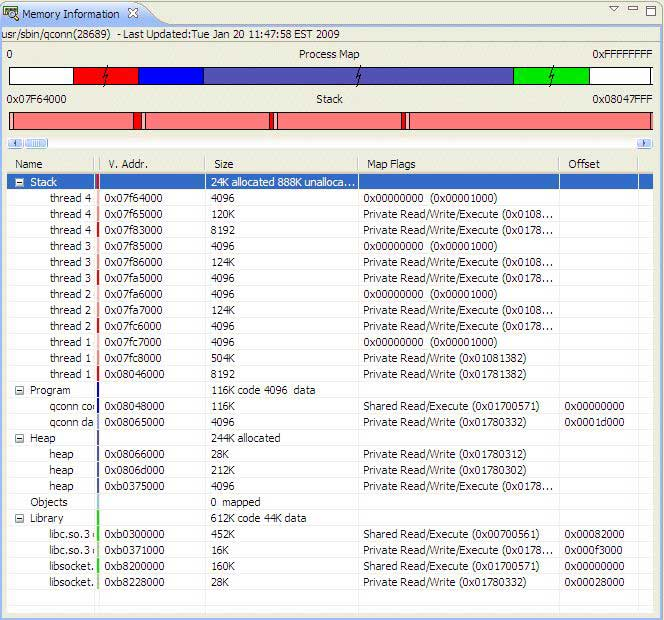
- Stack (red)
- guard (light)
- unallocated (medium)
- allocated (dark)
- Program (royal blue)
- data (light)
- code (dark)
- Heap (blue violet)
- Objects (powder blue)
- Shared Library (green)
- data (light)
- code (dark)
- Unused (white)
The Process Memory pane shows the overall memory usage. To keep large sections of memory from visually overwhelming smaller sections, the view scales the display semilogarithmically and indicates compressed sections with a split.
Below the Process Memory pane, the Process Memory subpane shows your selected memory category (e.g. Stack, Library) linearly. The subpane colors the memory by subcategory (e.g. a stack's guard page), and shows unused memory.
The Memory Information view's table lists all the memory segments and the associated virtual address, size, permissions, and offset. The major categories list the total sizes for the subcategories (e.g. Library lists the sizes for code/data in the Size column). The Process Memory pane and subpane update their displays as you make selections in the table.
- Name
- The name of the category.
- V. Addr.
- The virtual address of the memory.
- Size
- The size of the section of memory. For the major categories, the column lists the totals for the minor categories.
- Map Flags
- The flags and protection bits for the memory block. See the mmap function's flags and prot arguments in the QNX Neutrino Library Reference.
- Offset
- The memory block's offset into shared memory, which is equal to the mmap function's off argument.
- Click the dropdown menu (
 ) in the view's toolbar and select
Categorize.
) in the view's toolbar and select
Categorize.
Stack errors
The Memory Information view lets you see how much stack memory your program's processes and threads use, and can warn you of potential stack errors.
Stack errors can occur if your program contains functions that are deeply recursive or use a significant amount of local data. Errors of this sort can be difficult to find using conventional testing and could cause your target system to fail in the field, likely when it's busiest and hence, needed the most.