You can launch a program with the debugger attached to step through the entire code path.
After building the debug variant of the executable, your next task is to create a debug configuration.
This type of launch configuration provides the information needed by the IDE to debug your program.
To launch your program with the debugger attached:
-
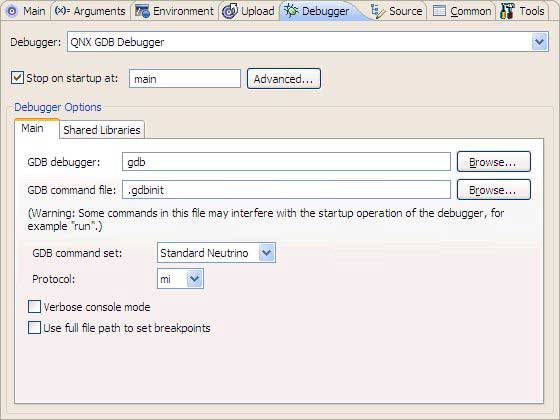
Select the Debugger tab.
The IDE changes to the Debug perspective.
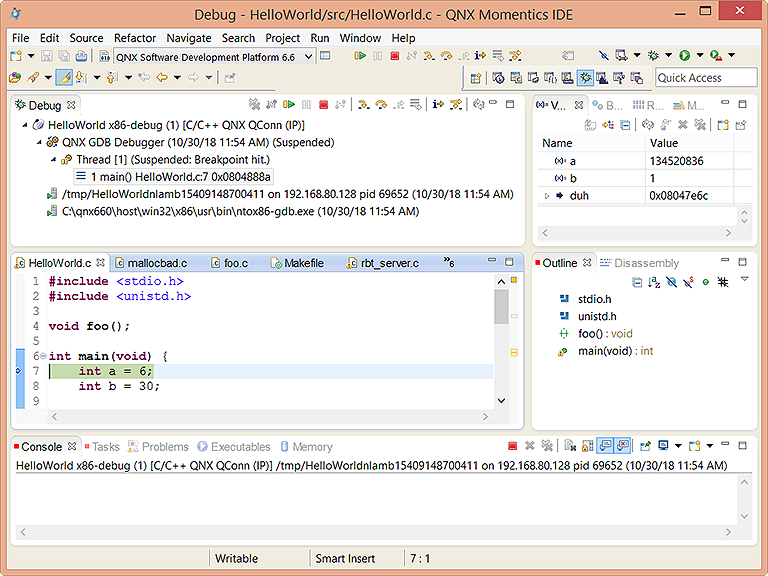
Figure 1. Default view of Debug perspective for HelloWorld QNX C++ project
Figure 1. Default view of Debug perspective for HelloWorld QNX C++ project
If launching a debugging session doesn't work when connected to a target that has qconn, ensure that pdebug is on the target and is located in one of the directories in PATH (typically /usr/bin).
Note:
- For serial debugging on a Windows host, the specification for the serial port has changed.
When specifying a device name, you have to set COM1 instead of /dev/com1;
otherwise, you'll receive an error similar to the following:
Debug session is not started - error:
Failed Launching Serial Debugger
Error initializing: /dev/com1: No such file or directory.
The device name /dev/com1 is no longer considered a valid name for a device. You must instead set COM1 in the Serial Port option in Debug Configuration dialog.
- The IDE automatically changes to the Debug perspective when you debug a program. If this default is no longer set, or if you wish to change to a different perspective when you debug, you can change the setting in the Tools tab of the Debug Configuration dialog.
- The IDE removes terminated debugging sessions from the Debug view when you launch a new session. This frees resources on your host and target systems. You can retain the completed debug sessions by deselecting Remove terminated launches when a new launch is created in the pane of the Preferences dialog.