 |
On Windows hosts, use QWinCfg, a graphical front end for qconfig. You can launch it from the Start menu. |
The QNX Momentics Tool Suite lets you install and work with multiple versions of Neutrino. Whether you're using the command line or the IDE, you can choose which version of the OS to build programs for.
When you install QNX Momentics, you get a set of configuration files that indicate where you've installed the software. The QNX_CONFIGURATION environment variable stores the location of the configuration files for the installed versions of Neutrino; on a self-hosted Neutrino machine, the default is /etc/qconfig.
If you're using the command-line tools, use the qconfig utility to configure your machine to use a specific version of the QNX Momentics Tool Suite.
|
On Windows hosts, use QWinCfg, a graphical front end for qconfig. You can launch it from the Start menu. |
Here's what qconfig does:
eval `qconfig -n "QNX Neutrino 6.3.0" -e`
When you start the IDE, it uses your current qconfig choice as the default version of the OS; if you haven't chosen a version, the IDE chooses an entry from the directory identified by QNX_CONFIGURATION. If you want to override the IDE's choice, you can choose the appropriate build target. For details, see “Version coexistence” in the Concepts chapter of the IDE User's Guide.
Neutrino uses these environment variables to locate files on the host machine:
The qconfig utility sets these variables according to the version of QNX Momentics that you specified.
To help you create portable applications, QNX Neutrino lets you compile for specific standards and include QNX- or Neutrino-specific code.
The header files supplied with the C library provide the proper declarations for the functions and for the number and types of arguments used with them. Constant values used in conjunction with the functions are also declared. The files can usually be included in any order, although individual function descriptions show the preferred order for specific headers.
When you use the -ansi option, qcc compiles strict ANSI code. Use this option when you're creating an application that must conform to the ANSI standard. The effect on the inclusion of ANSI- and POSIX-defined header files is that certain portions of the header files are omitted:
You can then use the qcc -D option to define feature-test macros to select those portions that are omitted. Here are the most commonly used feature-test macros:
Feature-test macros may be defined on the command line, or in the source file before any header files are included. The latter is illustrated in the following example, in which an ANSI- and POSIX-conforming application is being developed.
#define _POSIX_C_SOURCE=199506
#include <limits.h>
#include <stdio.h>
   …
#if defined(_QNX_SOURCE)
  #include "non_POSIX_header1.h"
  #include "non_POSIX_header2.h"
  #include "non_POSIX_header3.h"
#endif
You'd then compile the source code using the -ansi option.
You can also set the POSIXLY_CORRECT environment variable to 1. This environment variable is used by Unix-style operating systems to alter behavior to comply with POSIX where it's different from the OS's default behavior. It's a de facto standard that isn't defined by POSIX.
For example, if POSIXLY_CORRECT is set, functions that check the length of a pathname do so before removing any redundant . and .. components. If POSIXLY_CORRECT isn't set, the functions check the length after removing any redundant components.
If you need to include QNX- Neutrino-specific code in your application, you can wrap it in an #ifdef to make the program more portable. The qcc utility defines these preprocessor symbols (or manifest constants):
For example:
#if defined(__QNX__)
   /* QNX-specific (any flavor) code here */

   #if defined(__QNXNTO__)
      /* QNX Neutrino-specific code here */
   #else
      /* QNX 4-specific code here */
   #endif
#endif
For information about other preprocessor symbols that you might find useful, see the Manifests chapter of the Neutrino Library Reference.
In the rest of this chapter, we'll describe how to compile and debug a Neutrino system. Your Neutrino system might be anything from a deeply embedded turnkey system to a powerful multiprocessor server. You'll develop the code to implement your system using development tools running on the Neutrino platform itself or on any other supported cross-development platform.
Neutrino supports both of these development types:
|
You can choose how you wish to compile and link your programs: you can use tools with a command-line interface (via the qcc command) or you can use our Integrated Development Environment (see the IDE User's Guide). Our samples here illustrate the command-line method. |
This section describes the procedures for compiling and debugging for both types.
We'll now go through the steps necessary to build a simple Neutrino program that displays the text “Hello, world!”—the classic first C program.
Let's look at the spectrum of methods available to you to run your executable:
| If your environment is: | Then you can: |
|---|---|
| Self-hosted | Compile and link, and then run on the host |
| Cross-development, network filesystem link | Compile and link, load over the network filesystem, and then run on the target |
| Cross-development, debugger link | Compile and link, use the debugger to transfer the executable to the target, and then run on the target |
| Cross-development, rebuilding the image | Compile and link, rebuild the entire image, and then reboot the target. |
Which method you use depends on what's available to you. All the methods share the same initial step: write the code, then compile and link it for Neutrino on the platform that you wish to run the program on.
The “Hello, world!” program itself is very simple:
#include <stdio.h>

int
main (void)
{
    printf ("Hello, world!\n");
    return (0);
}
You compile it for PowerPC (big-endian) with the single line:
qcc -V gcc_ntoppcbe hello.c -o hello
This executes the C compiler with a special cross-compilation flag, -V gcc_ntoppcbe, that tells the compiler to use the gcc compiler, Neutrino-specific includes, libraries, and options to create a PowerPC (big-endian) executable using the GCC compiler.
To see a list of compilers and platforms supported, simply execute the command:
qcc -V
If you're using an IDE, refer to the documentation that came with the IDE software for more information.
At this point, you should have an executable called hello.
If you're using a self-hosted development system, you're done. You don't even have to use the -V cross-compilation flag (as was shown above), because the qcc driver defaults to the current platform. You can now run hello from the command line:
hello
If you're using a network filesystem, let's assume you've already set up the filesystem on both ends. For information on setting this up, see “TCP/IP with network filesystem” in the Sample Buildfiles appendix in Building Embedded Systems.
Using a network filesystem is a rich cross-development method, because you have access to remotely mounted filesystems. This is useful for a number of reasons:
For a network filesystem, you'll need to ensure that the shell's PATH environment variable includes the path to your executable via the network-mounted filesystem, or that you specify the full path to the executable. At this point, you can just type the name of the executable at the target's command-line prompt (if you're running a shell on the target):
hello
Once the debug agent is running, and you've established connectivity between the host and the target, you can use the debugger to upload the executable to the target, and then run and interact with it.
When the debug agent is connected to the host debugger, you can transfer files between the host and target systems. Note that this is a general-purpose file transfer facility—it's not limited to transferring only executables to the target.
In order for Neutrino to execute a program on the target, the program must be available for loading from some type of filesystem. This means that when you transfer executables to the target, you must write them to a filesystem. Even if you don't have a conventional filesystem on your target, there's a writable “filesystem” present under Neutrino—the /dev/shmem filesystem. This serves as a convenient RAM-disk for uploading the executables to.
If your system is deeply embedded and you have no connectivity to the host system, or you wish to build a system “from scratch,” you'll have to perform the following steps (in addition to the common step of creating the executables, as described above):
For more information, see Building Embedded Systems and the documentation for your Board Support Package.
When you're developing code, you almost always make use of a library, a collection of code modules that you or someone else has already developed (and hopefully debugged). Under Neutrino, we have three different ways of using libraries:
You can combine your modules with the modules from the library to form a single executable that's entirely self-contained. We call this static linking. The word “static” implies that it's not going to change—all the required modules are already combined into one executable.
Rather than build a self-contained executable ahead of time, you can take your modules and link them in such a way that the Process Manager links them to the library modules before your program runs. We call this dynamic linking. The word “dynamic” here means that the association between your program and the library modules that it uses is done at load time, not at link time (as was the case with the static version).
There's a variation on the theme of dynamic linking called runtime loading. In this case, the program decides while it's actually running that it wishes to load a particular function from a library.
To support the two major kinds of linking described above, Neutrino has two kinds of libraries: static and dynamic.
A static library is usually identified by a .a (for “archive”) suffix (e.g., libc.a). The library contains the modules you want to include in your program and is formatted as a collection of ELF object modules that the linker can then extract (as required by your program) and bind with your program at link time.
This “binding” operation literally copies the object module from the library and incorporates it into your “finished” executable. The major advantage of this approach is that when the executable is created, it's entirely self-sufficient—it doesn't require any other object modules to be present on the target system. This advantage is usually outweighed by two principal disadvantages, however:
A dynamic library is usually identified by a .so (for “shared object”) suffix (e.g., libc.so). Like a static library, this kind of library also contains the modules that you want to include in your program, but these modules are not bound to your program at link time. Instead, your program is linked in such a way that the Process Manager causes your program to be bound to the shared objects at load time.
The Process Manager performs this binding by looking at the program to see if it references any shared objects (.so files). If it does, then the Process Manager looks to see if those particular shared objects are already present in memory. If they're not, it loads them into memory. Then the Process Manager patches your program to be able to use the shared objects. Finally, the Process Manager starts your program.
Note that from your program's perspective, it isn't even aware that it's running with a shared object versus being statically linked—that happened before the first line of your program ran!
The main advantage of dynamic linking is that the programs in the system reference only a particular set of objects—they don't contain them. As a result, programs are smaller. This also means that you can upgrade the shared objects without relinking the programs. This is especially handy when you don't have access to the source code for some of the programs.
If you want to “augment” your program with additional code at runtime, you can call dlopen() This function call tells the system that it should find the shared object referenced by the dlopen() function and create a binding between the program and the shared object. Again, if the shared object isn't present in memory already, the system loads it. The main advantage of this approach is that the program can determine, at runtime, which objects it needs to have access to.
Note that there's no real difference between a library of shared objects that you link against and a library of shared objects that you load at runtime. Both modules are of the exact same format. The only difference is in how they get used.
By convention, therefore, we place libraries that you link against (whether statically or dynamically) into the lib directory, and shared objects that you load at runtime into the lib/dll (for “dynamically loaded libraries”) directory.
Note that this is just a convention—there's nothing stopping you from linking against a shared object in the lib/dll directory or from using the dlopen() function call on a shared object in the lib directory.
The development tools have been designed to work out of their processor directories (x86, ppcbe, etc.). This means you can use the same toolset for any target platform.
If you have development libraries for a certain platform, then put them into the platform-specific library directory (e.g., /x86/lib), which is where the compiler and tools look.
To link your application against a library, use the -l option to qcc, omitting the lib prefix and any extension from the library's name. For example, to link against libsocket, specify -l socket.
You can specify more than one -l option. The qcc configuration files might specify some libraries for you; for example, qcc usually links against libc. The description of each function in the Neutrino Library Reference tells you which library to link against.
The QNX Neutrino linker is a single-pass linker, so you must list all libraries after all objects (.o files) on the link line. If one library (say, lib1.a) has functions that call functions in another library (say, lib2.a), then put lib1.a before lib2.a) on the link command line.
By default, the tool chain links dynamically. We do this because of all the benefits mentioned above.
If you want to link everything statically, specify the -static option to qcc, which causes the link stage to look in the library directory only for static libraries (identified by a .a extension).
|
For this release of Neutrino, you can't use the floating point emulator (fpemu.so) in statically linked executables. |
Although we generally discourage linking statically, it does have this advantage: in an environment with tight configuration management and software QA, the very same executable can be regenerated at link time and known to be complete at runtime.
To link dynamically (the default), you don't have to do anything.
To link statically and dynamically (some libraries linked one way, other libraries linked the other way), the two keywords -Bstatic and -Bdynamic are positional parameters that can be specified to qcc. All libraries specified after the particular -B option are linked in the specified manner. You can have multiple -B options:
qcc ... -Bdynamic -l1 -l2 -Bstatic -l3 -l4 -Bdynamic -l5
This causes libraries lib1, lib2, and lib5 to be dynamically linked (i.e., qcc links against the files lib1.so, lib2.so and lib5.so), and libraries lib3 and lib4 to be statically linked (i.e., qcc links against the files lib3.a and lib4.a).
You may see the extension .1 appended to the name of the shared object (e.g., libc.so.1). This is a version number. Use the extension .1 for your first revision, and increment the revision number if required.
You may wish to use the above “mixed-mode” linking because some of the libraries you're using are needed by only one executable or because the libraries are small (less than 4 KB), in which case you'd be wasting memory to use them as shared libraries. Note that shared libraries are typically mapped in 4-KB pages and require at least one page for the “text” section and possibly one page for the “data” section.
|
When you specify -Bstatic or -Bdynamic, all subsequent libraries are linked in the specified manner. |
To create a shared object suitable for linking against:
|
Make sure that all objects and “static” libs that are pulled into a .so are position-independent as well (i.e., also compiled with -shared). |
If you make a shared library that has to static-link against an existing library, you can't static-link against the .a version (because those libraries themselves aren't compiled in a position-independent manner). Instead, there's a special version of the libraries that has a capital “S” just before the .a extension. For example, instead of linking against libsocket.a, you'd link against libsocketS.a. We recommend that you don't static-link, but rather link against the .so shared object version.
When you're building a shared object, you can specify the following option to qcc:
"-Wl,-hname"
(You might need the quotes to pass the option through to the linker intact, depending on the shell.)
This option sets the internal name of the shared object to name instead of to the object's pathname, so you'd use name to access the object when dynamically linking.
You might find this useful when doing cross-development (e.g., from a Windows system to a QNX Neutrino target). If several versions of a library provide the same interface, they'd have the same SONAME; if another version of the library is incompatible with earlier versions, its SONAME would be different.
For example, you might have several versions of the C library, and libc.so could be a symbolic link to the most recent version:
# ls -l libc.so*
lrwxrwxrwx  1 root      root              9 Jul 09  2012 libc.so -> libc.so.3
-rwxr-xr-x  1 root      root         429288 Jul 09  2010 libc.so.1
-rwxr-xr-x  1 root      root          28902 Jul 09  2010 libc.so.2
-rwxr-xr-x  1 root      root         645784 Jun 20  2012 libc.so.3
# objdump -x libc.so.3 | grep SONAME
  SONAME               libc.so.3
# objdump -x libc.so.2 | grep SONAME
  SONAME               libc.so.2
# objdump -x libc.so.1 | grep SONAME
  SONAME               libc.so.1
# objdump -x libc.so | grep SONAME
  SONAME               libc.so.3
If you link against libc.so when it's a link to version 2, you won't be able to execute your program on a system that has only version 3 of the library.
The runtime linker supports the following features that you can use to optimize the way it resolves and relocates symbols:
The term “lazy” in all of them can cause confusion, so let's compare them briefly before looking at them in detail:
RTLD_LAZY doesn't imply anything about whether dependencies are loaded; it says where a symbol is looked up. It allows the looking up of symbols that are subsequently opened with the RTLD_GLOBAL flag, when looking up a symbol in an RTLD_LAZY-opened object and its resolution scope fails. The term “resolution scope” is intentional since we don't know what it is by just looking at RTLD_LAZY; it differs depending on whether you specify RTLD_WORLD, RTLD_LAZYLOAD, or both.
Lazy binding (also known as lazy linking or on-demand symbol resolution) is the process by which symbol resolution isn't done until a symbol is actually used. Functions can be bound on-demand, but data references can't.
All dynamically resolved functions are called via a Procedure Linkage Table (PLT) stub. A PLT stub uses relative addressing, using the Global Offset Table (GOT) to retrieve the offset. The PLT knows where the GOT is, and uses the offset to this table (determined at program linking time) to read the destination function's address and make a jump to it.
To be able to do that, the GOT must be populated with the appropriate addresses. Lazy binding is implemented by providing some stub code that gets called the first time a function call to a lazy-resolved symbol is made. This stub is responsible for setting up the necessary information for a binding function that the runtime linker provides. The stub code then jumps to it.
The binding function sets up the arguments for the resolving function, calls it, and then jumps to the address returned from resolving function. The next time that user code calls this function, the PLT stub jumps directly to the resolved address, since the resolved value is now in the GOT. (GOT is initially populated with the address of this special stub; the runtime linker does only a simple relocation for the load base.)
The semantics of lazy-bound (on-demand) and now-bound (at load time) programs are the same:
Lazy binding is controlled by the -z option to the linker, ld. This option takes keywords as an argument; the keywords include (among others):
Lazy binding is the default. If you're using qcc (as we recommend), use the -W option to pass the -z option to ld. For example, specify -Wl,-zlazy or -Wl,-znow.
There are cases where the default lazy binding isn't desired. For example:
There's a way to do each of these:
LD_BIND_NOW=1 ./foobar
|
By default,
pdebug
sets LD_BIND_NOW to 1.
If you start
gdb
from the command line on a self-hosted QNX Neutrino system, gdb
also sets LD_BIND_NOW to 1.
Without LD_BIND_NOW, you'd see a different backtrace for the first function call into the shared object as the runtime linker resolves the symbol. On subsequent calls to the same function, the backtrace would be as expected. You can prevent pdebug from setting LD_BIND_NOW by specifying the -l (“el”) option. |
qcc -Wl,-znow -o libfoo.so foo.o bar.o
qcc -Wl,-znow -o foobar -lfoo.so -lbar.so
To see if a binary was built with -znow, use the appropriate variant of readelf. For example,
ntox86-readelf -d my_binary
The output includes the BIND_NOW dynamic tag if -znow was used when linking.
You can use the DL_DEBUG environment variable to get the runtime linker to display some debugging information. For more information, see “Diagnostics and debugging” and “Environment variables,” later in this chapter.
Applications with many symbols—typically C++ applications—benefit the most from lazy binding. For many C applications, the difference is negligible.
Lazy binding does introduce some overhead; it takes longer to resolve N symbols using lazy binding than with immediate resolution. There are two aspects that potentially save time or at least improve the user's perception of system performance:
Both of the above are typically true for C++ applications.
Lazy binding could affect realtime performance because there's a delay the first time you access each unresolved symbol, but this delay isn't likely to be significant, especially on fast machines. If this delay is a problem, use -znow
|
It isn't sufficient to use -znow on the shared object that has a function definition for handling something critical; the whole process must be resolved “now”. For example, you should probably link driver executables with -znow or run drivers with LD_BIND_NOW. |
RTLD_LAZY is a flag that you can pass to dlopen() when you load a shared object. Even though the word “lazy” in the name suggests that it's about lazy binding as described above in “Lazy binding,” it has different semantics. It makes (semantically) no difference whether a program is lazy- or now- bound, but for objects that you load with dlopen(), RTLD_LAZY means “there may be symbols that can't be resolved; don't try to resolve them until they're used.” This flag currently applies only to function symbols, not data symbols.
What does it practically mean? To explain that, consider a system that comprises an executable X, and shared objects P (primary) and S (secondary). X uses dlopen() to load P, and P loads S. Let's assume that P has a reference to some_function(), and S has the definition of some_function().
If X opens P without RTLD_LAZY binding, the symbol some_function() doesn't get resolved—not at the load time, nor later by opening S. However, if P is loaded with RTLD_LAZY | RTLD_WORLD, the runtime linker doesn't try to resolve the symbol some_function(), and there's an opportunity for us to call dlopen("S", RTLD_GLOBAL) before calling some_function(). This way, the some_function() reference in P is satisfied by the definition of some_function() in S.
There are several programming models made possible by RTLD_LAZY:
Lazy dependency loading (or on-demand dependency loading) is a method of loading the required objects when they're actually required. The most important effect of lazy loading is that the resolution scope is different for a lazyload dependency. While in a “normal” dependency, the resolution scope contains immediate dependencies followed by their dependencies sorted in breadth-first order, for a lazy-loaded object, the resolution scope ends with its first-level dependencies. Therefore, all of the lazy-loaded symbols must be satisfied by definitions in its first level dependencies.
Due to this difference, you must carefully consider whether lazy-load dependencies are suitable for your application.
Each dynamic object can have multiple dependencies. Dependencies can be immediate or implicit:
The ultimate dependent object is the executable binary itself, but we consider any object that needs to resolve its external symbols to be dependent. When referring to immediate or implicit dependencies, we always view them from the point of view of the dependent object.
Here are some other terms:
To use lazy loading, specify the RTLD_LAZYLOAD flag when you call dlopen().
The runtime linker creates the link map for the executable in the usual way, by creating links for each DT_NEEDED object. Lazy dependencies are represented by a special link, a placeholder that doesn't refer to actual object yet. It does, however, contain enough information for the runtime linker to look up the object and load it on demand.
The lookup scope for the dependent object and its regular dependencies is the link map, while for each lazy dependency symbol, the lookup scope gets determined on-demand, when the object is actually loaded. Its lookup scope is defined in the same way that we define the lookup scope for an object loaded with dlopen(RTLD_GROUP) (it's important that RTLD_WORLD not be specified, or else we'd be including all RTLD_GLOBAL objects in the lookup scope).
When a call to an external function is made from dependent object, by using the lazy binding mechanism we traverse its scope of resolution in the usual way. If we find the definition, we're done. If, however, we reach a link that refers to a not-yet-loaded dependency, we load the dependency and then look it up for the definition. We repeat this process until either a definition is found, or we've traversed the entire dependency list. We don't traverse any of the implicit dependencies.
The same mechanism applies to resolving immediate relocations. If a dependent object has a reference to global data, and we don't find the definition of it in the currently loaded objects, we proceed to load the lazy dependencies, the same way as described above for resolving a function symbol. The difference is that this happens at the load time of the dependent object, not on first reference.
|
This approach preserves the symbol-overriding mechanisms provided by LD_PRELOAD. |
Another important thing to note is that lazy-loaded dependencies change their own lookup scope; therefore, when resolving a function call from a lazy-loaded dependency, the lookup scope is different than if the dependency was a normal dependency. As a consequence, lazy loading can't be transparent as, for example, lazy binding is (lazy binding doesn't change the lookup scope, only the time of the symbol lookup).
When you're developing a complex application, it may become difficult to understand how the runtime linker lays out the internal link maps and scopes of resolution. To help determine what exactly the runtime linker is doing, you can use the DL_DEBUG environment variable to make the linker display diagnostic messages.
Diagnostic messages are categorized, and the value of DL_DEBUG determines which categories are displayed. The special category help doesn't produce diagnostics messages, but rather displays a help message and then terminates the application.
To redirect diagnostic messages to a file, set the LD_DEBUG_OUTPUT environment variable to the full path of the output file.
|
For security reasons, the runtime linker unsets LD_DEBUG_OUTPUT if the binary has the setuid bit set. |
The following environment variables affect the operation of the runtime linker:
|
For security reasons, the runtime linker unsets LD_DEBUG_OUTPUT and ignores the value of LD_LIBRARY_PATH and LD_PRELOAD if the binary has the setuid bit set. |
A value of 1 (one) is the same as all.
Now let's look at the different options you have for debugging the executable. Just as you have two basic ways of developing (self-hosted and cross-development), you have similar options for debugging.
The debugger can run on the same platform as the executable being debugged:
Debugging in a self-hosted environment.
In this case, the debugger communicates directly with the program you're debugging. You can choose this type of debugging by running the target procfs command in the debugger—or by not running the target command at all.
|
It's also possible to use the target qnx command so that the debugger communicates with a local program via a debug agent, but this is the same as debugging in a cross-development environment. |
A procfs session is possible only when the debugger and the program are on the same QNX Neutrino system.
The debugger can run on one platform to debug executables on another:
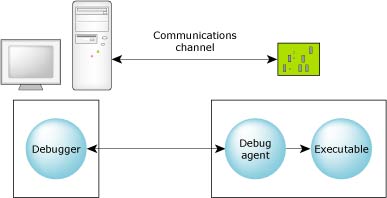
Debugging in a cross-development environment.
In a cross-development environment, the host and the target systems must be connected via some form of communications channel.
The two components, the debugger and the debug agent, perform different functions. The debugger is responsible for presenting a user interface and for communicating over some communications channel to the debug agent. The debug agent is responsible for controlling (via the /proc filesystem) the process being debugged.
All debug information and source remains on the host system. This combination of a small target agent and a full-featured host debugger allows for full symbolic debugging, even in the memory-constrained environments of small targets.
|
In order to debug your programs with full source using the symbolic debugger, you'll need to use the -g option to tell the C compiler and linker to include symbolic information in the object and executable files. For details, see the qcc docs in the Utilities Reference. Without this symbolic information, the debugger can provide only assembly-language-level debugging. |
The GNU debugger is a command-line program that provides a very rich set of options. You'll find a tutorial-style doc called “Using GDB” as an appendix in this manual.
You can invoke gdb by using the following variants, which correspond to your target platform:
| For this target: | Use this command: |
|---|---|
| ARM | ntoarm-gdb |
| Intel | ntox86-gdb |
| MIPS | ntomips-gdb |
| PowerPC | ntoppc-gdb |
| SH4 | ntosh-gdb |
For more information, see the gdb entry in the Utilities Reference.
When a breakpoint is encountered and the process-level debug agent (pdebug) is in control, the process being debugged and all its threads are stopped. All other processes continue to run and interrupts remain enabled.
When the process's threads are stopped and the debugger is in control, you may examine the state of any thread within the process. For more info on examining thread states, see the gdb docs.
The pdebug agent may either be included in the image and started in the image startup script or started later from any available filesystem that contains pdebug. The pdebug command-line invocation specifies which device is used.
You can start pdebug in one of three ways, reflecting the nature of the connection between the debugger and the debug agent:
If the host and target systems are connected via a serial port, then the debug agent (pdebug) should be started with the following command:
pdebug devicename[,baud]
This indicates the target's communications channel (devicename) and specifies the baud rate (baud).
For example, if the target has a /dev/ser2 connection to the host, and we want the link to be 115,200 baud, we would specify:
pdebug /dev/ser2,115200
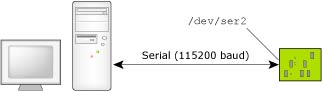
Running the process debug agent with a serial link at 115200 baud.
The Neutrino target requires a supported serial port. The target is connected to the host using either a null-modem cable, which allows two identical serial ports to be directly connected, or a straight-through cable, depending on the particular serial port provided on the target.
The null-modem cable crosses the Tx/Rx data and handshaking lines. In our PowerPC FADS example, you'd use a a straight-through cable. Most computer stores stock both types of cables.
Null-modem cable pinout.
If the host and the target are connected via some form of TCP/IP connection, the debugger and agent can use that connection as well. Two types of TCP/IP communications are possible with the debugger and agent: static port and dynamic port connections (see below).
The Neutrino target must have a supported Ethernet controller. Note that since the debug agent requires the TCP/IP manager to be running on the target, this requires more memory.
This need for extra memory is offset by the advantage of being able to run multiple debuggers with multiple debug sessions over the single network cable. In a networked development environment, developers on different network hosts could independently debug programs on a single common target.
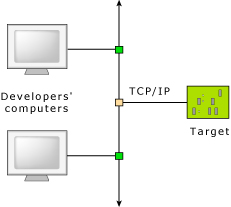
Several developers can debug a single target system.
For a static port connection, the debug agent is assigned a TCP/IP port number and listens for communications on that port only. For example, the pdebug 1204 command specifies TCP/IP port 1204:
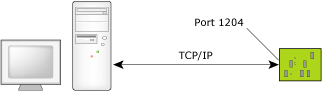
Running the process debug agent with a TCP/IP static port.
If you have multiple developers, each developer could be assigned a specific TCP/IP port number above the reserved ports 0 to 1024.
For a dynamic port connection, the debug agent is started by inetd and communicates via standard input/output. The command to run the process debug agent in this case is as follows (from the inetd.conf file):
pdebug stream tcp nowait root /usr/bin/pdebug pdebug -
The inetd process fetches the communications port from the configuration file (typically /etc/services). For example:
pdebug 1234/tcp
The host process debugger (gdb) connects to the port explicitly, but the debug agent (pdebug) has no direct knowledge of the port.
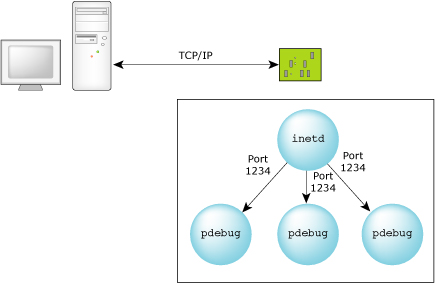
For a TCP/IP dynamic port connection, the inetd process manages the port.
Note that this method is also suitable for one or more developers. It's effectively what the qconn daemon does to provide support to remote IDE components; qconn listens to a port and spawns pdebug on a new, dynamically determined port.
The following buildfile supports multiple sessions specifying the same port. Although the port for each session on the pdebug side is the same, inetd causes unique ports to be used on the debugger side. This ensures a unique socket pair for each session.
Note that inetd should be included and started in your boot image. The pdebug program should also be in your boot image (or available from a mounted filesystem).
The config files could be built into your boot image (as in this sample buildfile) or linked in from a remote filesystem using the [type=link] command:
[type=link] /etc/services=/mount_point/services
[type=link] /etc/inetd.conf=/mount_point/inetd.conf
Here's the buildfile:
[virtual=x86,bios +compress] boot = {
    startup-bios -N node428
    PATH=/proc/boot:/bin:/apk/bin_nto:./ procnto
}

[+script] startup-script = {
# explicitly running in edited mode for the console link
    devc-ser8250 -e -b115200 &
    reopen
    display_msg Welcome to Neutrino on a PC-compatible BIOS system
# tcp/ip with a NE2000 Ethernet adaptor
    io-pkt-v4 -dne2000 -ptcpip if=ndi0:10.0.1.172 &
    waitfor /dev/socket
    inetd &
    pipe &
# pdebug needs devc-pty to be running
    devc-pty &
# NFS mount of the Neutrino filesystem
    fs-nfs3 -r 10.89:/x86 /x86 -r 10.89:/home /home &
# CIFS mount of the NT filesystem
    fs-cifs -b //QA:10.0.1.181:/QARoot /QAc apk 123 &
# NT Hyperterm needs this to interpret backspaces correctly
    stty erase=08
    reopen /dev/console
    [+session] esh &
}

[type=link] /usr/lib/ldqnx.so.2=/proc/boot/libc.so
[type=link] /lib=/x86/lib
[type=link] /tmp=/dev/shmem         # tmp points to shared memory
[type=link] /dev/console=/dev/ser2  # no local terminal
[type=link] /bin=/x86/bin           # executables in the path
[type=link] /apk=/home/apk          # home dir

[perms=+r,+x]          # Boot images made under MS-Windows
                       # need to be reminded of permissions.
devn-ne2000.so
devnp-shim.so
libc.so
fpemu.so
libsocket.so

[data=copy]            # All executables that can be restarted
                       # go below.
devc-ser8250
io-pkt-v4
pipe
devc-pty
fs-nfs3
fs-cifs
inetd
esh
stty
ping
ls
                       # Data files are created in the named
                       # directory.
/etc/hosts = {
127.0.0.1    localhost
10.89        node89
10.222       node222
10.326       node326
10.0.1.181   QA node437
10.241       APP_ENG_1
}

/etc/services = {
ftp           21/tcp
telnet        23/tcp
pdebug        8000/tcp
}

/etc/inetd.conf = {
ftp     stream    tcp    nowait    root    /bin/fdtpd       fdtpd
telnet  stream    tcp    nowait    root    /bin/telnetd     telnetd
pdebug  stream    tcp    nowait    root    /usr/bin/pdebug  pdebug -
}
In this example, we'll be debugging our “Hello, world!” program via a TCP/IP link. We go through the following steps:
The buildfile for the image follows these sections.
Let's assume an x86 target using a basic TCP/IP configuration. The following lines (from the sample buildfile at the end of this chapter) show what's needed to host the sample session:
io-pkt-v4 -dne2000 -ptcpip if=ndi0:10.0.1.172 &
devc-pty &
[+session] pdebug 8000 &
The above specifies that the host IP address is 10.0.1.172. The pdebug program is configured to use port 8000.
We'll be using the x86 compiler. Note the -g option, which makes the compiler include debugging information:
$ qcc -V gcc_ntox86 -g -o hello hello.c
For this simple example, the source can be found in our working directory. First, let's start the session; to reduce document clutter, we'll run the debugger in quiet mode:
ntox86-gdb -quiet
The gdb debugger provides its own shell; by default its prompt is (gdb). Specify the target IP address and the port used by pdebug:
(gdb) target qnx 10.0.1.172:8000
Remote debugging using 10.0.1.172:8000
0x0 in ?? ()
Upload the debug executable to the target. (This can be a slow operation. If the executable is large, you may prefer to build the executable into your target image.) Note that the file has to be in the target system's pathname space, so we can get the executable via a network filesystem, ftp, or, if no filesystem is present, via the upload command:
(gdb) upload hello /tmp/hello
Load the symbolic debug information from the current working directory (in this case, hello must reside on the host system):
(gdb) sym hello
Reading symbols from hello...done.
Start the program:
(gdb) run /tmp/hello
Starting program:  /tmp/hello
Trying to find symbol file for ldqnx.so.2
Retrying dynamic interpreter in libc.so.2
Set a breakpoint on main():
(gdb) break main
Breakpoint 1 at 0x80483ae: file hello.c, line 8.
Allow the program to continue to the breakpoint found at main():
(gdb) c
Continuing.
Breakpoint 1, main () at hello.c:8
8       setprio (0,9);
We're now ready to start the debug session:
(gdb)
While you're in a debug session, you can use any of the following commands as the next action for starting the actual debugging of the project:
For more information about these commands and their arguments, see the Using GDB appendix in this guide, or use the help cmd command in gdb.
Let's see how to use some of these basic commands. First, here's the list command:
(gdb) l
3
4   main () {
5
6       int x,y,z;
7
8       setprio (0,9);
9       printf ("Hi ya!\n");
10
11      x=3;
12      y=2;
Press Enter to repeat the last command:
(gdb) <enter>
13      z=3*2;
14
15      exit (0);
16
17  }
Break on line 11:
(gdb) break 11
Breakpoint 2 at 0x80483c7: file hello.c, line 11.
Continue until the first breakpoint:
(gdb) c
Continuing.
Hi ya!

Breakpoint 2, main () at hello.c:11
11      x=3;
Notice that the above command went past the printf() statement at line 9, so the output from the call is displayed on the screen.
Inspect variable y, using the short form of the inspect command:
(gdb) ins y
$1 = -1338755812
Get some help on the step and next commands:
(gdb) help s
Step program until it reaches a different source line.
Argument N means do this N times (or till program stops
for another reason).
(gdb) help n
Step program, proceeding through subroutine calls.
Like the "step" command as long as subroutine calls don't
happen; when they do, the call is treated as one instruction.
Argument N means do this N times (or till program stops
for another reason).
Go to the next line of execution:
(gdb) n
12      y=2;
(gdb) n
13      z=3*2;
(gdb) inspect z
$2 = 1
(gdb) n
15      exit (0);
(gdb) inspe z
$3 = 6
Continue program execution:
(gdb) continue
Continuing.

Program exited normally.
Quit the debugger session:
(gdb) quit
The program is running. Exit anyway? (y or n) y
[virtual=x86,bios +compress] boot = {
    startup-bios -N node428
    PATH=/proc/boot:./ procnto
}

[+script] startup-script = {
# explicitly running in edited mode for the console link
    devc-ser8250 -e -b115200 &
    reopen
    display_msg Welcome to Neutrino on a PC-compatible BIOS system
# tcp/ip with a NE2000 Ethernet adaptor
    io-pkt-v4 -dne2000 -ptcpip if=ndi0:10.0.1.172 &
    waitfor /dev/socket
    pipe &
# pdebug needs devc-pty
    devc-pty &
# start pdebug on port 8000
    [+session] pdebug 8000 &
}

[type=link] /usr/lib/ldqnx.so.2=/proc/boot/libc.so.2
[type=link] /tmp=/dev/shmem         # tmp points to shared memory
[type=link] /dev/console=/dev/ser2  # no local terminal

[perms=+r,+x]         # Boot images made under MS-Windows need
                      # to be reminded of permissions.
devn-ne2000.so
devnp-shim.so
libc.so
fpemu.so
libsocket.so

[data=copy]            # All executables that can be restarted
                       # go below.
devc-ser8250
io-pkt-v4
pipe
devc-pty
pdebug
esh
ping
ls
QNX includes support for Mudflap through libmudflap. Mudflap provides you with pointer checking capabilities based on compile time instrumentation as it transparently includes protective code to potentially unsafe C/C++ constructs at run time.
For information about the available options for this feature, see the GNU website at:
http://gcc.gnu.org/onlinedocs/gcc-4.2.4/gcc/Optimize-Options.html#index-fmudflap-502
For more debugging information, you can search the GNU website for the topic “Mudflap Pointer Debugging”.
This debugging feature is enabled by passing the option -fmudflap to the compiler. For front ends that support it , it instruments all risky pointer and array dereferencing operations, some standard library string and heap functions, and some associated constructs with range and validity tests.
The instrumentation relies on a separate runtime library (libmudflap), which is linked into a program if -fmudflap -lmudflap is given at link time. Runtime behavior of the instrumented program is controlled by the environment variable MUDFLAP_OPTIONS . You can obtain a list of options by setting MUDFLAP_OPTIONS to -help and calling a Mudflap compiled program.
For your multithreaded programs:
Additionally, if you want instrumentation to ignore pointer reads, you'll need to use the option -fmudflapir in addition to the option -fmudflap or -fmudflapth (for multithreaded). This option creates less instrumentation, resulting in faster execution.
|
Regardless of whether you're using qcc or gcc, for both the compile and link steps you must specify the option -fmudflap or -fmudflapth. |