The System Resources view shows various pieces of information about your system's processes. You can choose one of the following displays:
To select which display you want to see, click the menu dropdown button (![]() ) in the System Resources view.
) in the System Resources view.
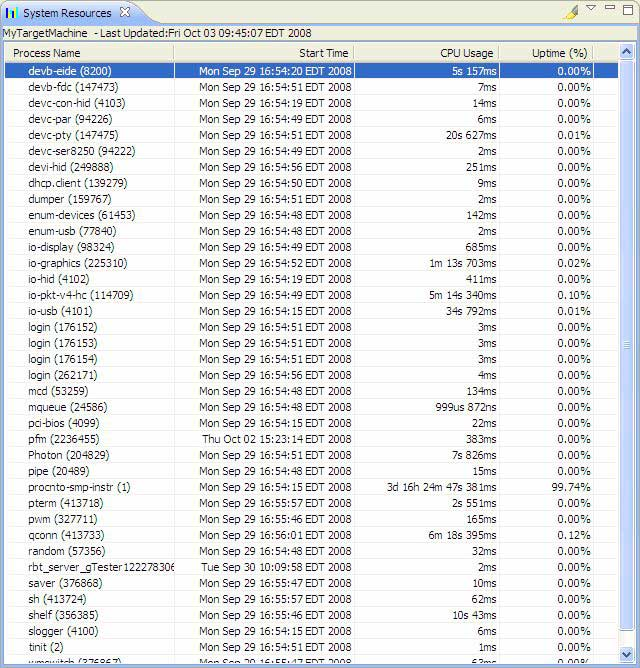
System Uptime display
The System Uptime display provides information about the start time, CPU usage time, and the usage as a percent of the total uptime, for all the processes running on your selected target:
You can change the highlight color in the Colors and Fonts preferences ().
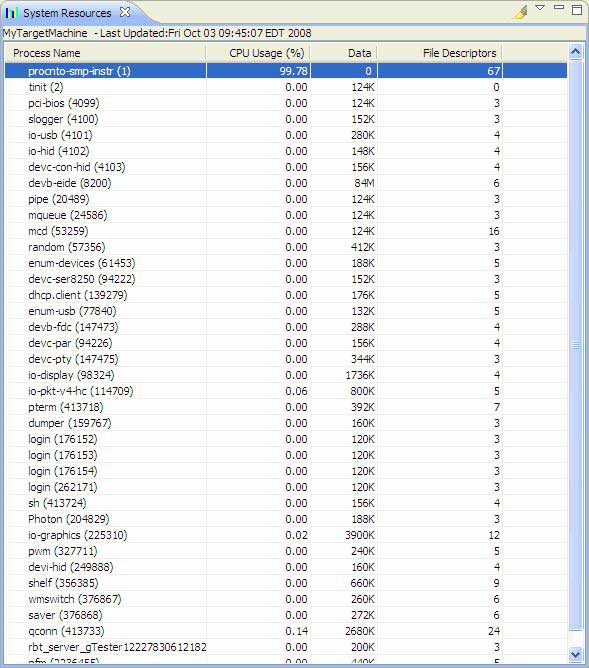
General Resources display
The General Resources display provides information about CPU usage, heap size, and the number of open file descriptors, for all the processes running on your selected target.
You can change the highlight color in the Colors and Fonts preferences ().
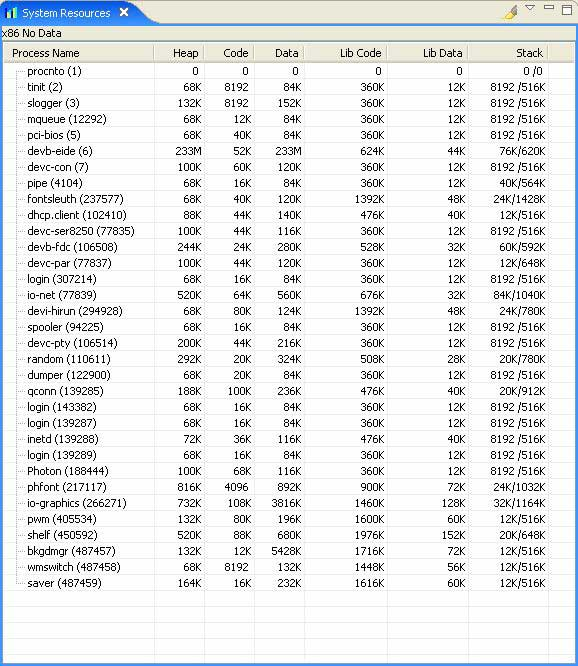
Memory Resources display
The Memory Resources display provides information about the heap, program, library, and stack usage for each process running on your selected target:
You can change the highlight color in the Colors and Fonts preferences ().
To learn more about the meaning of the values shown in the Memory Resources display, see the Finding memory errors and leaks chapter in this guide.