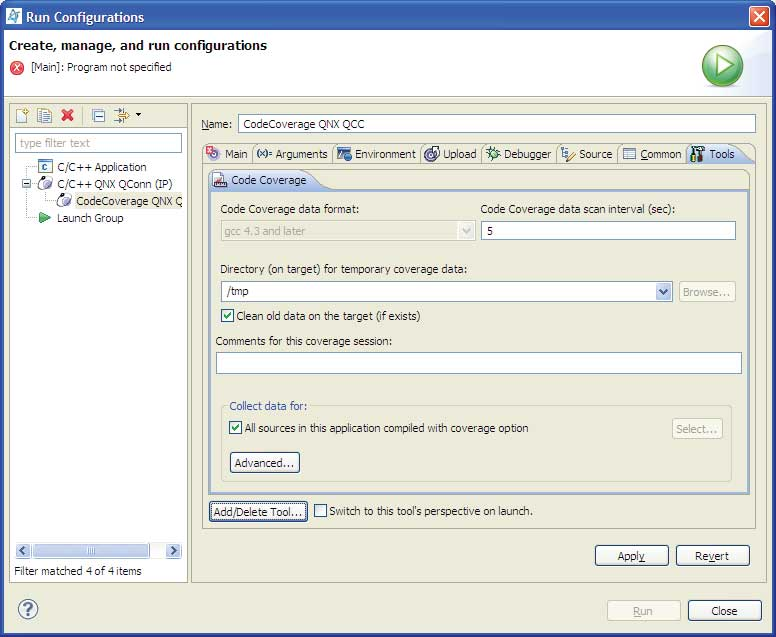
The Tools tab lets you add runtime analysis tools to the launch. To do this, click the Add/Delete Tool button at the bottom of the tab:
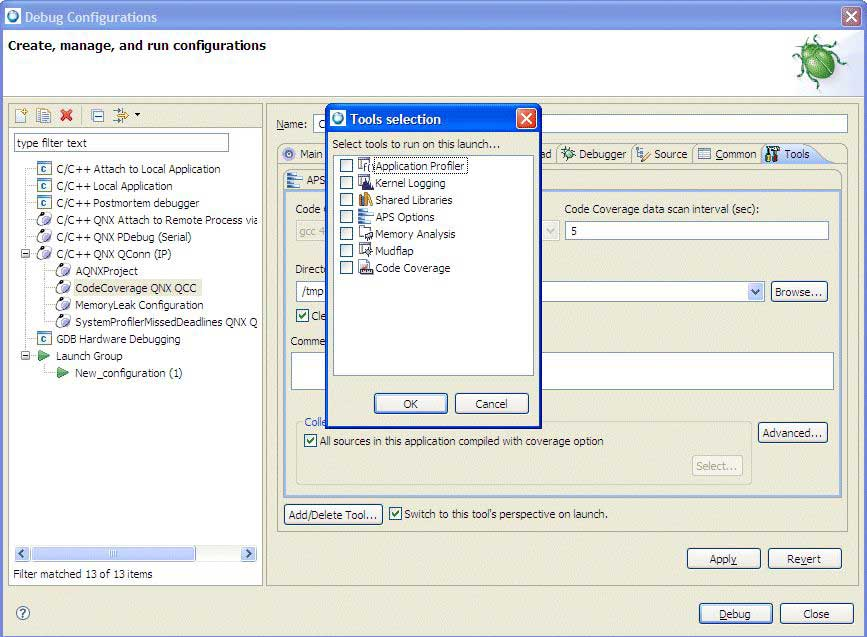
The Tools tab in the Launch Configurations dialog.
You can add the following tools (some launch options affect which tools are available):
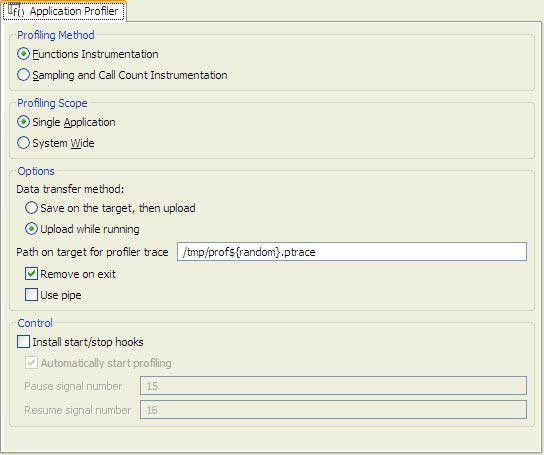
- Application Profiler
- Lets you count how many times functions are called, who called which functions, and so on. For more information about this tool, see the Profiling an Application chapter.
- Memory Analysis
- Lets you track memory errors. For more information about this tool, see the Finding memory errors and leaks chapter.
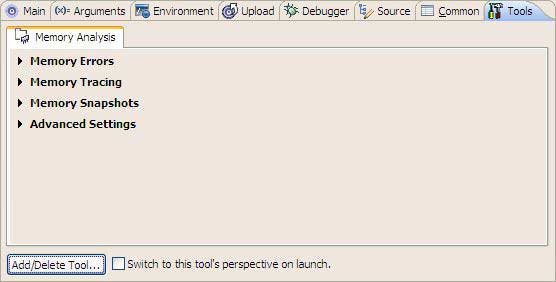
For detailed information about the fields on this tab, see Launching your program with Memory Analysis.
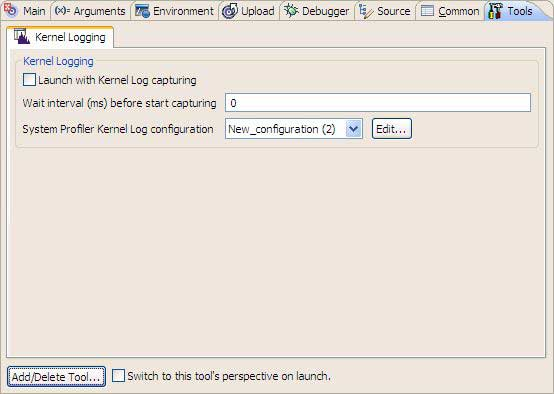
- Kernel Logging
- Lets you perform a system wide profile to monitor all processes that execute on a specific set of CPUs.
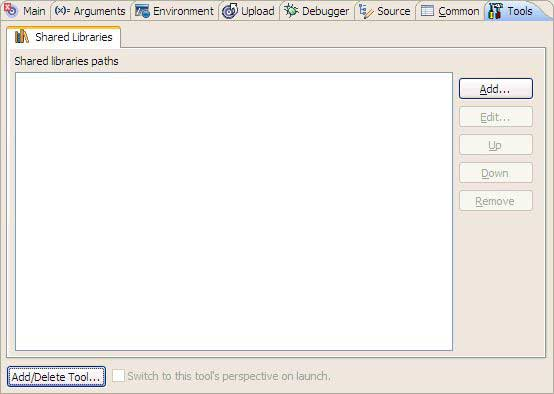
- Shared Libraries
- Lets you add paths to shared library references.
- APS Options
- Lets you select the partition that the program runs in.
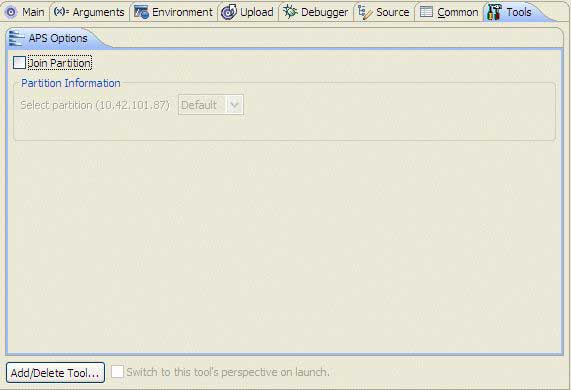
Selecting Join Partition indicates that you want so specify a specific partition in which to run the program.
The Select Partition list shows the available partitions that you can use to run your program.
- Code Coverage
- Lets you measure what parts of your program have run, and what parts still need to be tested. For more information about this tool, see the Using Code Coverage chapter.
If you want the IDE to open the appropriate perspective for the tool during the launch, then check Switch to this tool's perspective on launch.