![[Previous]](prev.gif) |
![[Contents]](contents.gif) |
![[Index]](keyword_index.gif) |
![[Next]](next.gif) |
![[Previous]](prev.gif) |
![[Contents]](contents.gif) |
![[Index]](keyword_index.gif) |
![[Next]](next.gif) |
 |
This version of this document is no longer maintained. For the latest documentation, see http://www.qnx.com/developers/docs. |

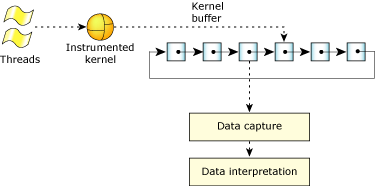
Overall view of the SAT.
We've provided tracelogger as the default data-capture program. Although it's possible for you to write your own utility from scratch, there's little need to. More likely, you would tailor the tracelogger code to suit your own needs. Although this section describes the data-capturing process generically, much of it will focus on tracelogger's capabilities.

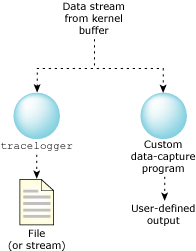
Possible data capture configurations.
Some of the general concepts are explained here, but for a full description of the tracelogger utility and its options, see its entry in the Neutrino Utilities Reference.
The data-capture utility is the “messenger” between the Instrumented Kernel and the filesystem.
The main function of the data-capture utility is to save the buffers given to it by the Instrumented Kernel to an output device (which may be a file or something else). In order to accomplish this function, the utility must also:
The Instrumented Kernel is fully configurable to log all events or only a specified few. Also, it can gather simplified information (in “fast” mode) or detailed information (in “wide” mode).
You can run tracelogger in normal or daemon mode. In normal mode, you configure, start, and stop the tracing from the command line; in daemon (-d1) mode, your application must do everything from code. However, if you also use the -E option, you get the best of both modes: the command-line configuration of normal mode, and the full control of daemon mode.
Here's an outline of the strengths, weaknesses, and features of these modes:
| Feature | Normal mode | Daemon mode | Extended daemon mode |
|---|---|---|---|
| tracelogger support | Full | Limited | Full |
| Controllability | Limited | Full | Full |
| Events recorded by default | All | None | All |
| Configuration difficulty | Easy | Harder | Easy |
| Configuration method | Command line only | User program, using calls to TraceEvent() (see the Neutrino Library Reference) | Command line and user program |
| Logging starts | Instantaneously | Through a user program; also calls to TraceEvent() | Through a user program; also calls to TraceEvent() |
Most events can be described in a single event buffer slot (“simple event”). When there's too much information to describe the event in a single buffer slot, the event is described in multiple event buffer slots (“combine event”). These events buffer slots all look the same so there's no need for the data-capture program to distinguish between them.
For more information about simple events and combine events, see the User Data Interpretation chapter.
In wide mode, the Instrumented Kernel uses as many buffer slots as are necessary to fully log the event— the amount of space is theoretically unlimited and can span several kilobytes for a single event. Except for rare occasions, it doesn't exceed four 16-byte spaces.
In fast mode, the Instrumented Kernel uses only one buffer slot per event, no matter how many event buffer slots would be used to describe it in wide mode. Because simple events require only a single event buffer slot anyway, they are logged completely. On the other hand, combine events are “incomplete” because only the first of the event buffer slots is logged for each event.
For a detailed list of events and their respective entries, see the appendix.
Because the circular linked list of buffers can't hope to store a complete log of event activity for any significant amount of time, the tracebuffer must be handed off to a data-capture program. Normally the data-capture program would pipe the information to either an output device or a file.
By default, the tracelogger utility saves the output to the binary file /dev/shmem/tracebuffer but you can specify a filename.
You must configure the Instrumented Kernel before logging. The Instrumented Kernel configuration settings include:
The event configurations are made in an additive or subtractive manner—starting from no events, specific classes or events may be added, or starting from all events, specific ones may be excluded.
You may make these configurations through the data-capture program or another, independent program. The Instrumented Kernel retains the settings.
 |
Multiple programs access a single Instrumented Kernel configuration. Changing settings in one process supersedes the settings in another. For this reason, you should always make the configurations in an additive manner when using multiple processes. |
You must perform the data-capture configuration using a custom program. The tracelogger utility will do only very basic configuring, and only in normal mode, where it logs all events.
The custom program:
Note that the custom program would be created by the user.
The tracelogger utility handles only the buffer-saving function.
For configuration details, see TraceEvent() in the Neutrino Library Reference.
For sample configuration files, see the Tutorial chapter.
![[Previous]](prev.gif) |
![[Contents]](contents.gif) |
![[Index]](keyword_index.gif) |
![[Next]](next.gif) |