![[Previous]](prev.gif) |
![[Contents]](contents.gif) |
![[Index]](keyword_index.gif) |
![[Next]](next.gif) |
|
|
|
|
 |
This version of this document is no longer maintained. For the latest documentation, see http://www.qnx.com/developers/docs. |
In this chapter:
One of the most frequently used tools in the traditional design-develop-debug cycle is the source-level debugger. In the IDE, this powerful tool provides an intuitive debugging environment that's completely integrated with the other workbench tools, giving you the flexibility you need to best address the problems at hand.
Have you ever had to debug several programs simultaneously? Did you have to use separate tools when the programs were written in different languages or for different processors? The IDE's source debugger provides a unified environment for multiprocess and multithreaded debugging of programs written in C, C++, Embedded C++, or Java. You can debug such programs concurrently on one or multiple remote target systems.
In order to use the full power of the Debug perspective, you must use executables compiled for debugging. These executables contain additional debug information that lets the debugger make direct associations between the source code and the binaries generated from that original source. In the IDE, you'll see different icons: a arrowhead icon for executables that weren't compiled for debugging, or a bug for those that were.
The IDE debugger uses GDB as the underlying debug engine. It translates each GUI action into a sequence of GDB commands, and then processes the output from GDB to show the current state of the program being debugged.
The IDE updates the views in the Debug perspective only when the program is suspended.
 |
Editing your source after compiling causes the line numbering to be out of step because the debug information is tied directly to the source. Similarly, debugging an optimized binary can also cause unexpected jumps in the execution trace. |
Although you can debug a regular executable, you'll get much more information and control by building debug variants of the executables. To build an executable with debugging information, you must pass the -g option to the compiler. If you're using a QNX Make project, the filename for the debug variant has _g appended to it.
To specify the -g option from the project options:
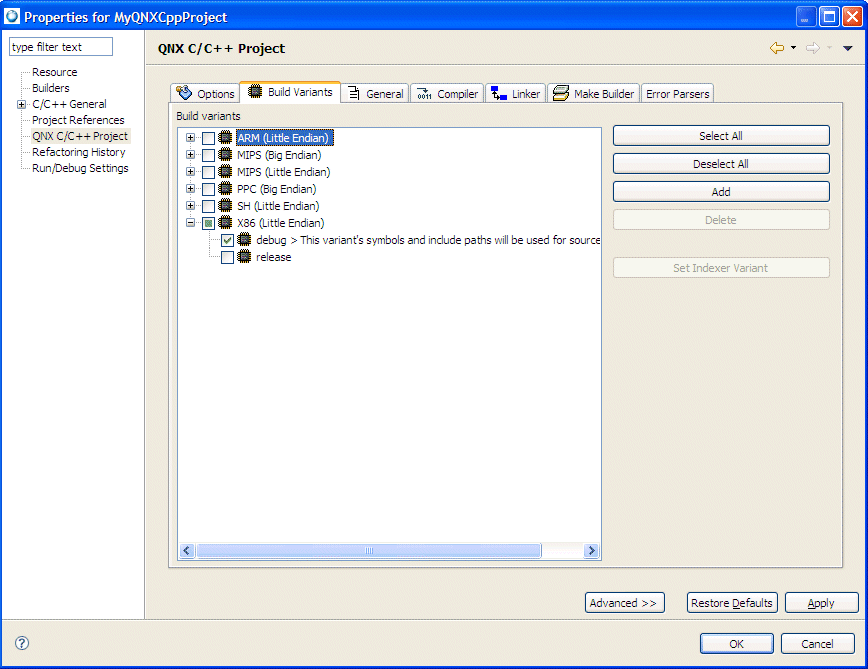
For more information about setting project options, see the Common Wizards Reference chapter.
On most systems, GDB has no special support for debugging programs that create additional processes using the fork() function. By default, when a program forks, GDB continues to debug the parent process, while the child process runs unimpeded. If you set a breakpoint in any code that the child then executes, the child will get a SIGTRAP signal that causes it to terminate (unless it catches the signal).
To debug the child process, include a call to sleep() in the code that the child process executes after the fork(). It may be useful to sleep only if a certain environment variable is set, or a certain file exists, so that the delay doesn't occur when you don't want to run GDB on the child. While the child is sleeping, use the ps program to get its process ID, and then instruct GDB to attach to the child process (use a new invocation of GDB if you're also debugging the parent process). From that point on, you can debug the child process like any other process that you attach to.
The modes available are:
parent — The original process is debugged after a fork(). The child process runs unimpeded. This type is the default.
child — The new process is debugged after a fork(). The parent process runs unimpeded.
ask — The debugger will prompt you for either parent or child.
If you ask to debug a child process and a vfork() is followed by an exec(), GDB executes the new target up to the first breakpoint encountered in the new target. If there's a breakpoint set on main() in your original program, the breakpoint will also be set on the main() function for the child process.
When a child process is spawned by vfork(), you can't debug the child or parent until an exec() call completes.
If you issue a run command to GDB after an exec() call executes, the new target restarts. To restart the parent process, use the file command with the parent executable name as its argument.
You can use the catch command to make GDB stop whenever a fork(), vfork(), or exec() call is made.
For additional information about catchpoints, see “Adding event breakpoints.”
|
For more information about starting your programs and the launch configuration options, see the Launch Configurations Reference chapter. |
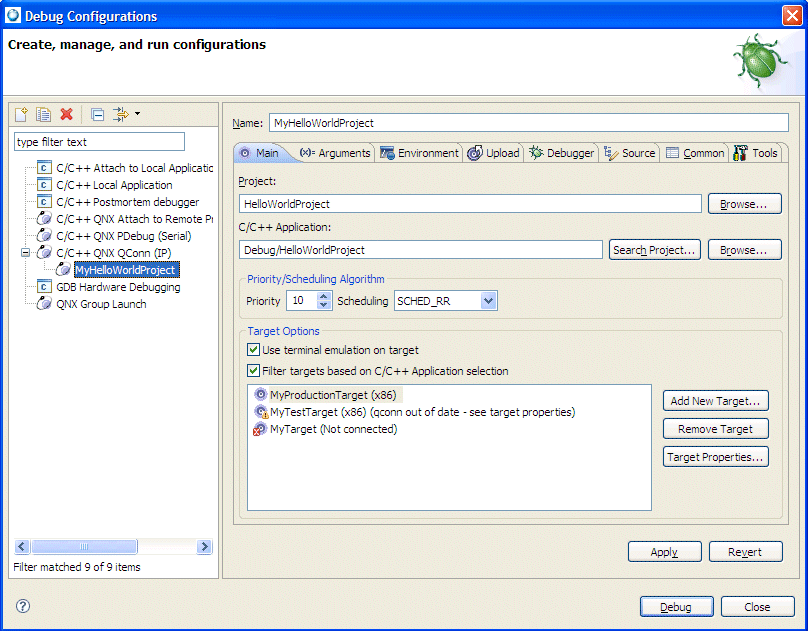
After building a debug-enabled executable, your next step is to create a launch configuration for that executable so you can run and debug it:
The launch configuration dialog appears.
|
This feature works only when you use gcc 4.3 or higher and gdb 6.8. |
The IDE changes to the Debug perspective.
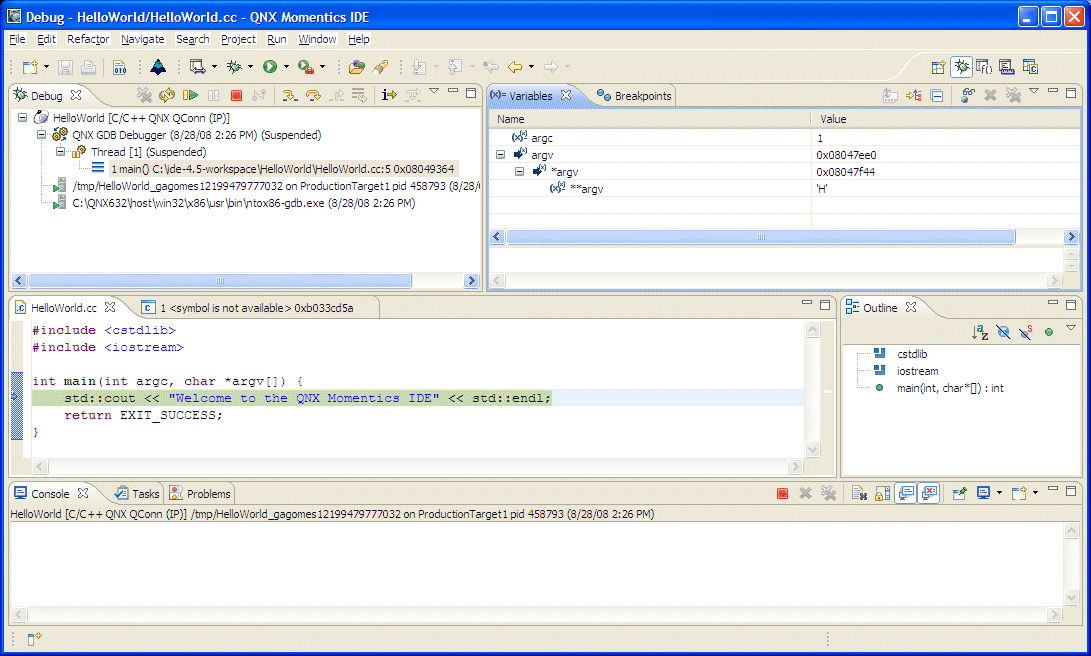
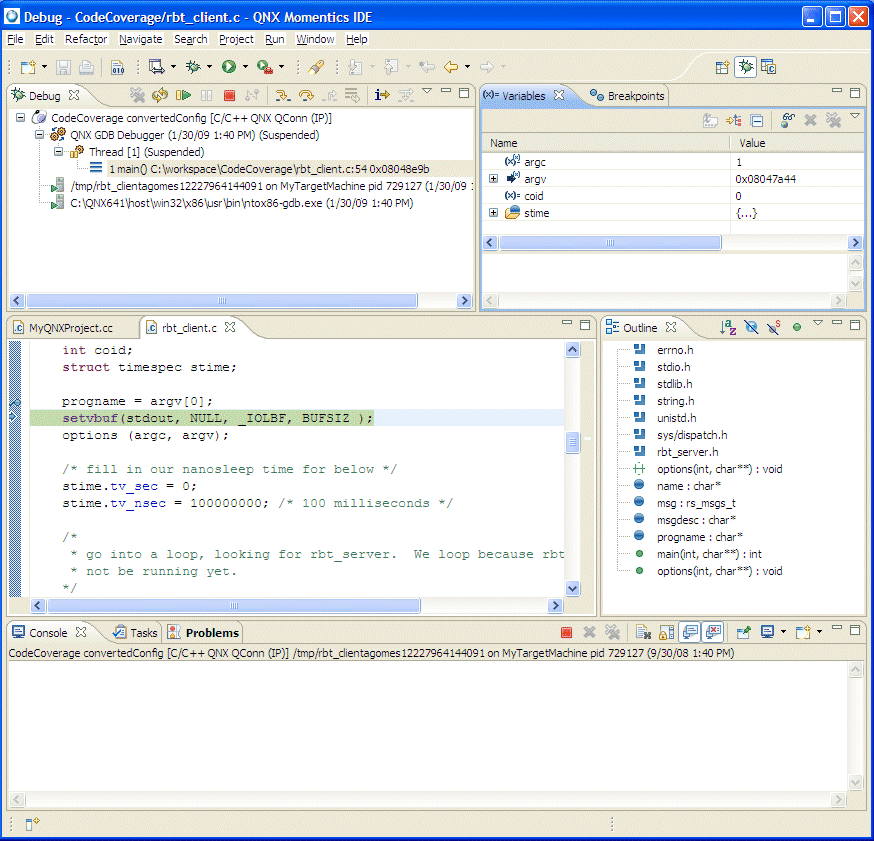
The default view of the Debug perspective for a simple HelloWorld QNX C++ project.
If launching a debugging session doesn't work when connected to the target with qconn, ensure that pdebug is on the target, and it is located in one of the directories in the PATH that qconn uses (typically /usr/bin).
|
By default:
|
|
The contents of all views in the Debug perspective are driven by the selections you make in the Debug view. |
The Debug view shows the target debugging information in a tree hierarchy.
The Debug view lets you manage the debugging or running of a program in the workbench. This view shows the stack frame for the suspended threads for each target you're debugging. Each thread in your program appears as a node in the tree. The view shows the process for each program you're running:
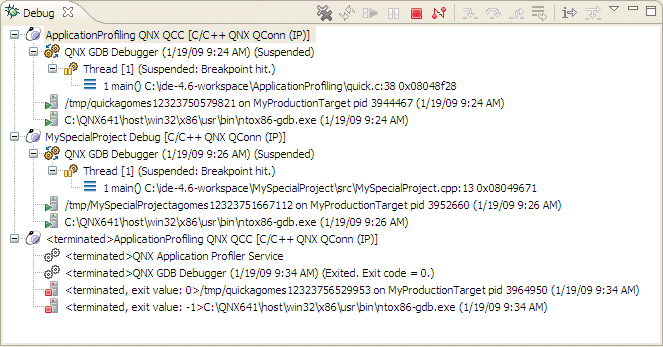
The Debug view shows the stack frame for the suspended threads.
The number that appears after a thread label is a reference counter, not a thread identification number (TID).
The IDE shows stack frames as child elements, and it includes the reason for the suspension beside the thread, (for example, the end of the stepping range was reached, a breakpoint was encountered, or a signal was received). When a program exits, the IDE also shows the exit code.
The Debug view shows the launch, debugger, and thread instance, as well as the stack frame, application, and controls for each target you're debugging.
Overview of the Debug view.
|
The number beside the thread label is a reference counter for the IDE, not a thread ID (TID) number. |
The label includes the thread's state. In the example above, the thread was suspended because the program hit a breakpoint. You can't suspend only one thread in a process; suspension affects all threads.
The Debug view also drives the C/C++ editor; as you step through your program, the C/C++ editor highlights the location of the execution pointer.
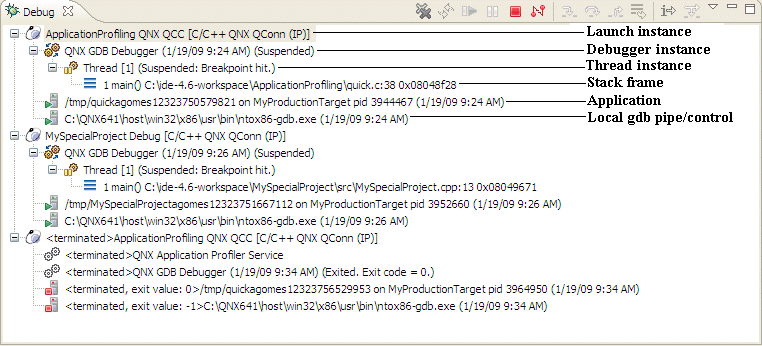
The Debug view shows the target information in a tree hierarchy as follows (shown here with a sample of the possible icons):
| Session item | Description | Possible icons |
|---|---|---|
| Launch instance | Launch configuration name and type (e.g. Stack Builder [C/C++ QNX QConn (IP)]) | |
| Debugger instance | Debugger name and state (e.g. QNX GDB Debugger (Breakpoint hit)) | |
| Thread instance | Thread number and state (e.g. Thread[1] (Suspended)) | |
| Stack frame instance | Stack frame number, function, filename, and line number |
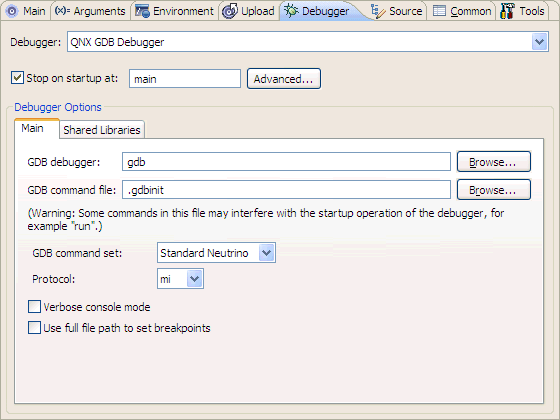
After you start the debugger, it stops (by default) in main() and waits for your input. (For information about changing this setting, see “Debugger tab” in the Launch Configurations Reference chapter.)
The debugging controls appear in the following places (but not all together in any one place):
The controls are overridden by breakpoints. For example, if you ask the program to step over a function (i.e. run until it finishes that function) and the program hits a breakpoint, the program pauses on that breakpoint, even though it hasn't finished the function.
You can control your debug session in various ways:
|
The icons and menu items are context-sensitive. For example, you can use the Terminate action to kill a process, but not a stack frame. |
The icons available from the Toolbar are:
| Action | Icon | Hotkey | Description |
|---|---|---|---|
| Remove All Terminated Launches | F8 | Clear the Debug view of all terminated launches. | |
| Restart | Rerun the process from the beginning. | ||
| Resume | F8 | Run the process freely from the current point. | |
| Suspend | Regain control of the running process. | ||
| Terminate | Kill the process. | ||
| Disconnect | Terminate the connection between the debugger and the remote debug target. | ||
| Step Into | F5 | Step forward one line, going into the function calls. | |
| Step Over | F6 | Step forward one line without going into the function calls. Note that the remaining code that was skipped by stepping is still executed. | |
| Step return | F7 | Return from the function that was stepped into. Note that the remaining code that was skipped by returning is still executed. | |
| Drop To Frame | Re-enter the current stack frame in the Debug view. | ||
| Instruction Stepping Mode | Toggle whether the operators work on machine instructions, or source code only. | ||
| Use Step Filters | Change to use step filters to filter out types that you don't want to see and/or step through while debugging in the current Debug View. |
You'll probably use the Debug view primarily to control your program flow.
To control your debug execution:
Even if you're running your debug session without the Debug view showing, you can use the hotkeys (or the Run menu) to step through your program. You can enable the debug hotkeys in any perspective.
To see a list of the currently active hotkeys, press Ctrl-Shift-L or choose . To customize the debug hotkeys:
You can control your debug session using the C/C++ editor by having the program run until it hits the line your cursor is sitting on. If the program never hits that line, the program runs until it finishes or hits another breakpoint.
You can also use the C/C++ editor's context menu to resume execution at a specific line, or to add a watch expression.
To use the C/C++ editor to debug a program:
|
Note that Run To Line works only in the current stack frame. That is, you can use Run to Line only within the currently executing function. |
In addition to controlling the individual stepping of your programs, you can also control the debug session itself (e.g. terminate the session, stop the program, and so on) using the debug launch controls available in the Debug view (or in the view's right-click menu).
As with the other debug controls, these are context-sensitive; some are disabled depending on whether you've selected a thread, a process, and so on, in the Debug view.
| Action | Icon | Description |
|---|---|---|
| Terminate | Kill the selected process. | |
| Terminate & Remove | Kill the selected process and remove it from the Debug view. | |
| Terminate All | Kill all active processes in the Debug view. | |
| Disconnect | Detach the debugger (i.e. gdb) from the selected process (useful for debugging attached processes). | |
| Remove All Terminated Launches | Clear all the killed processes from the Debug view. | |
| Restart | Restart the process. |
|
The debugger keeps the project's files open while the program is running. Be sure to terminate the debug session before you try to rebuild the project; otherwise, the build will fail. |
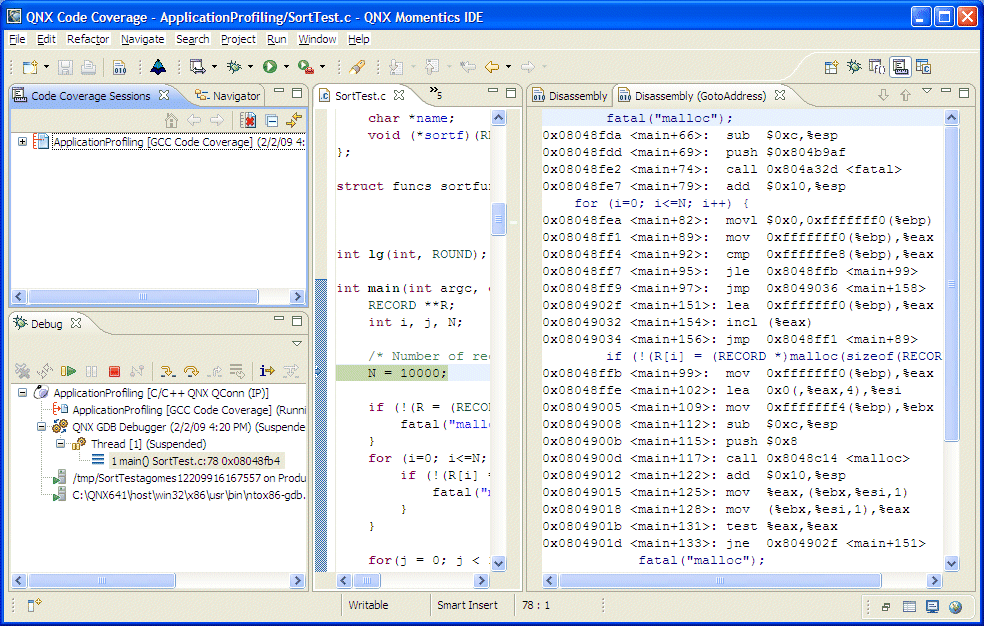
You can also examine your program as it steps into functions that you don't have source code for, such as printf(). Normally, the debugger steps over these functions, even when you click Step Into. When the instruction pointer enters functions for which it doesn't have the source, the IDE shows the function in the Disassembly view.
The workbench adds the Disassembly view to the Debug perspective:
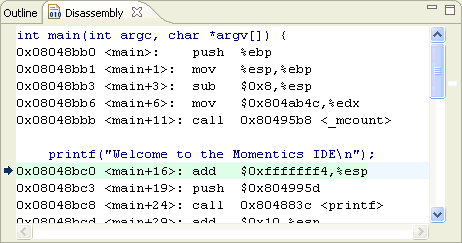
The Disassembly view lets you examine your program as it steps into functions.
If you click in this view or use the Toggle Instruction Stepping icon (![]() ) to give focus to this view, the operators (e.g. Run to Line) operate on machine instructions instead of the source code.
) to give focus to this view, the operators (e.g. Run to Line) operate on machine instructions instead of the source code.
In the Disassembly view, you can jump to any memory address to view the section of disassembly, starting at a specified memory address (a hexadecimal or decimal value. The IDE then queries the debugger for the disassembly for that memory address, and refreshes the view to show a section of disassembly starting with that address.
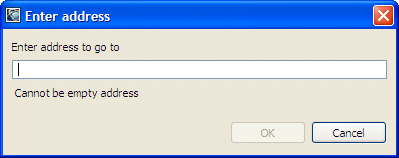
To jump to a memory address:
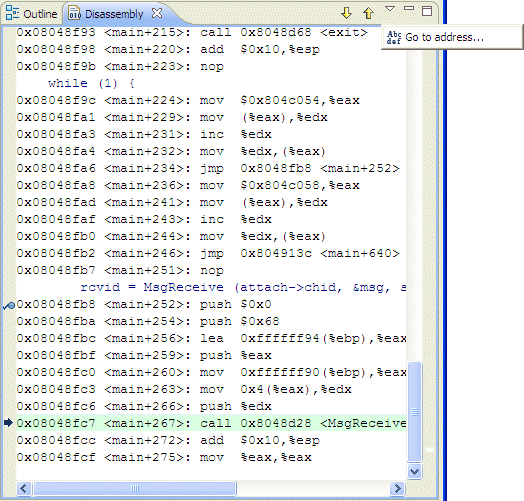
The Enter Address dialog appears.
This action takes the memory address and creates a new Disassembly (Go To Address) view with a section of disassembly starting with the specified address.
To use this feature, you'll need to do the following:
The secondary Disassembly (Go To Address) view shows the result from the Goto Address action, and the disassembly block in the view remains the same when you step through your debugging process.
Besides the Debug view, you'll find several other useful views in the Debug perspective:
| To: | Use this view: |
|---|---|
| Inspect variables | Variables |
| Use breakpoints and watchpoints | Breakpoints |
| Evaluate expressions | Expressions |
| Inspect registers | Registers |
| Inspect a process's memory | Memory |
| Inspect shared library usage | Modules |
| Monitor signal handling | Signals |
| View your output | Console |
| Interact with GDB | Console |
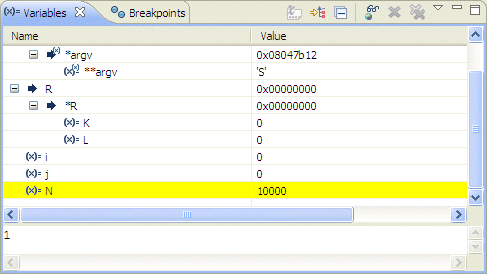
The Variables view shows information about the variables in the currently selected stack frame:
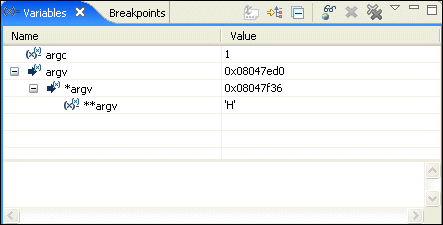
At the bottom of the view, the Detail pane shows the value of the selected variable.
|
If you happen to have multiple variables of the same name, the one most in scope is evaluated. |
When the execution stops, the changed values are highlighted in yellow (by default). Like the other debug-related views, the Variables view doesn't try to keep up with the execution of a running program; it updates the display only when execution stops.
You can decide whether or not to show the variable type (e.g.
int) by clicking the Show Type
Names toggle button (![]() ).
The Show Type Names button is unavailable
when columns are visible.
).
The Show Type Names button is unavailable
when columns are visible.
You can also control whether or not the IDE tracks all your program's variables. See the “Debugger tab” section in the Launch Configurations Reference chapter.
|
Tracking all the variables can reduce your program's performance. |
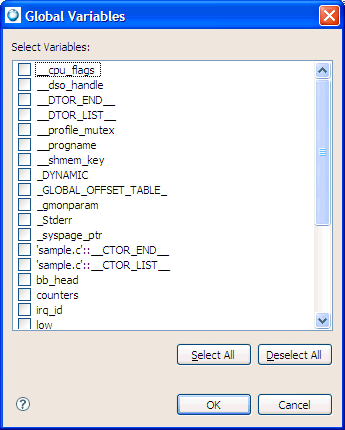
By default, global variables aren't shown in the Variables view. To add global variables to the view:
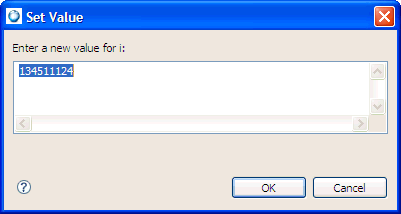
While debugging a program, you may wish to manually change the value of a variable to test how your program handles the setting or to speed through a loop.
To change a variable value while debugging:
|
You can also change a variable's value in the Detail pane at the bottom of the Variables view. Click the value, change it, and then press Ctrl-S to save the new value. |
You can prevent the debugger from reading the value of variables from the target. You might use this feature for variables that are either very sensitive or specified as volatile. This can also improve your program's performance.
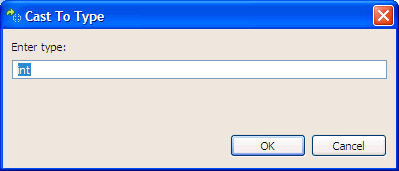
To change a variable to a different type:
For more information about the Memory view, see Inspecting a process's memory.
The Breakpoints view lists all the breakpoints and watchpoints you've set in your open projects:
The Breakpoints view shows you existing breakpoints and watchpoints that are currently set.
A breakpoint makes your program stop whenever a certain point in the program is reached. For each breakpoint, you can add conditions to better control whether or not your program stops.
A watchpoint is a special breakpoint that stops the program's execution whenever the value of an expression changes, without specifying where this may happen. Unlike breakpoints, which are line-specific, watchpoints are event-specific and take effect whenever a specified condition is true, regardless of when or where it occurred.
An event breakpoint is similar to breakpoint that's set on a specific event rather than a specific line of source code.
| Object | Icon |
|---|---|
| Breakpoint | |
| Watchpoint (read) | |
| Watchpoint (write) | |
| Watchpoint (read and write) |
|
If the breakpoint or watchpoint is for a connected target, the IDE places a
check mark on the icon. For example:
|
The rest of this section describes how to:
You set breakpoints on an executable line of a program. When you debug the program, the execution is suspended before that line of code is executed.
To add a breakpoint:
A dot appears, indicating the breakpoint:
A corresponding dot also appears in the Breakpoints view, along with the name of the file in which you set the breakpoint.
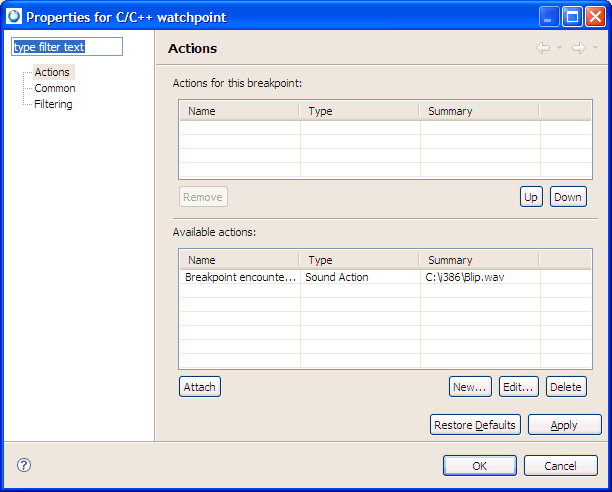
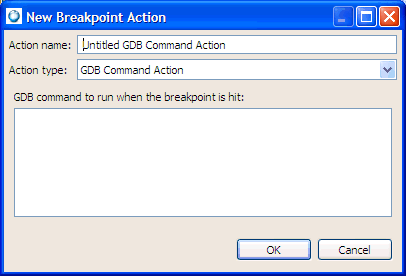
You can define one or more actions to attach to any breakpoint. When the debugger encounters a breakpoint, the appropriate action is executed.
To set an action for a breakpoint:
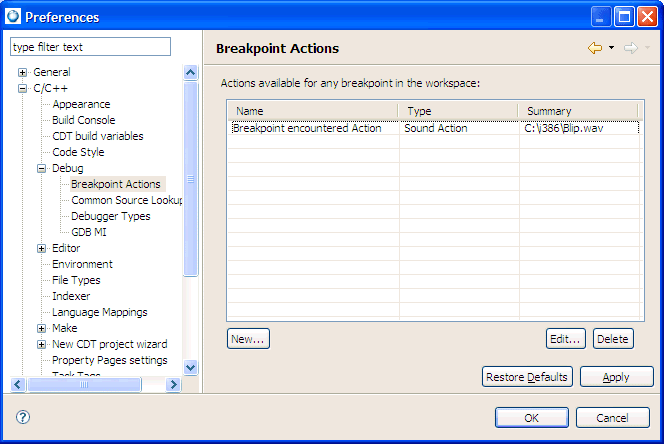
You can also set the breakpoint actions directly from the Breakpoint view:
|
If you select the GDB Command Action for your Action Type, you must enter each GDB command on a separate line in the command textbox; only one command per line is allowed. |
As the debugger encounters the breakpoint, any defined GDB commands will run and the commands' results will appear in the GDB console.
|
Watchpoints are allowed only on global variables. |
To add a watchpoint:
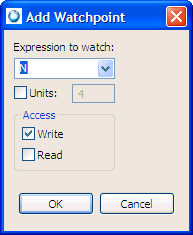
The expression may be anything that can be evaluated inside an if statement (e.g. y==1).
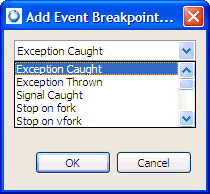
You can set event breakpoints for these types of events: exception caught and exception thrown.
|
Currently, you can't set event breakpoints for these types of events: signal caught, stop on fork, stop on vfork, stop on exec, process exit, process start, end, library load and unload, and thread start, end, and join. |
To add an event breakpoint:
After you've set your breakpoint or watchpoint, the IDE unconditionally halts the program when:
or:
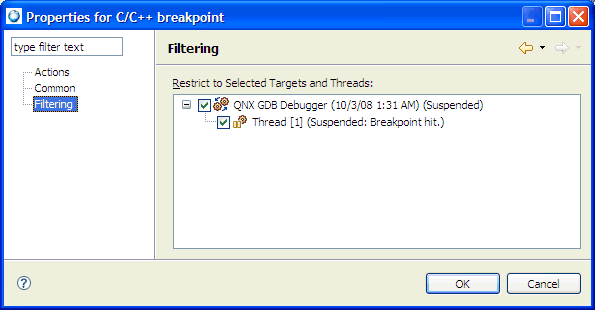
To set the properties for a breakpoint or watchpoint:
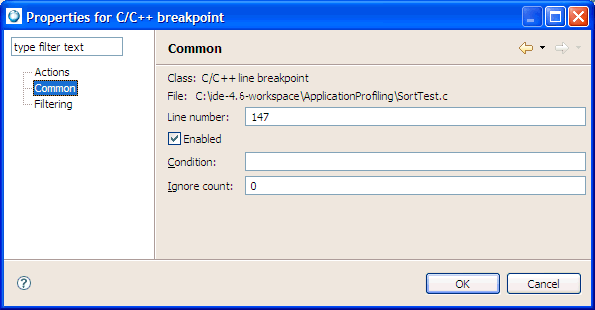
In the Condition field, enter the Boolean expression to evaluate. The expression may be anything that can be evaluated inside an if statement (e.g. x > y). The default is TRUE.
In the Ignore Count field, enter the number of times the breakpoint or watchpoint may be hit before it begins to take effect (not the number of times the condition is true). The default is 0.
You may wish to temporarily deactivate a breakpoint or watchpoint without losing the information it contains.
For breakpoints only, right-click the breakpoint in the editor area and select Disable Breakpoint or Enable Breakpoint.
To disable or enable multiple breakpoints or watchpoints:
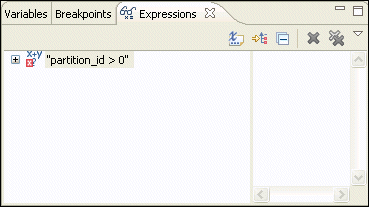
The Expressions view lets you evaluate and examine the value of expressions. To show this view, choose .
|
The Expressions view is similar to the Variables view; for more information, see the “Inspecting variables” section in this chapter. |
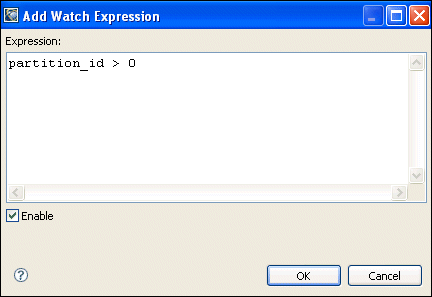
To evaluate an expression:
The Registers view shows information about the registers in the currently selected stack frame. When the execution stops, the changed values are highlighted. To show this view, choose .
|
The Registers view is similar to the Variables view; for more information, see the “Inspecting variables” section in this chapter. |
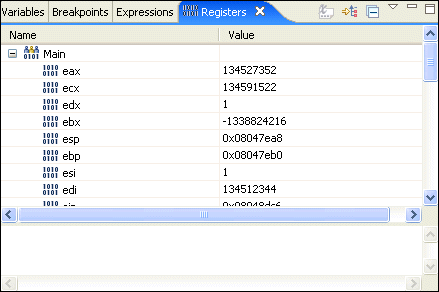
The Registers view shows the registers for the selected stack frame.
You can also customize the colors in the Registers view and change the default value of the Show Type Names option.
The Register View toolbar icons are:
| Icon | Description |
|---|---|
| Shows the type beside each register value (i.e. int.) | |
| Changes to toggle the display of the logical structures shown in the view. | |
| Collapses all of the currently expanded registers. | |
| Provides various layout options for the Breakpoints view. |
The Registers view context menu commands include:
| Command | Description |
|---|---|
| Add Register Group | Opens the Register Group dialog, which lets you define a register group that is shown in the Registers view. |
| Assign Value | Assigns a value to the selected register. |
| Cast To Type | Opens the Cast To Type dialog to change the selected instance to a different datatype. |
| Change Value | Opens the Set Value dialog to change the value of the selected register. |
| Content Assist | Opens a content assist dialog at the current cursor location. |
| Copy | Copies the currently selected text (or element) to the clipboard. |
| Copy Registers | Copies the register names and contents to the clipboard. |
| Create Watch Expression | Converts the selected register into a watch expression. |
| Cut | Copies the currently selected text (or element) to the clipboard, and removes the element. |
| Disable | Disables the selected register. |
| Display As Array | Opens the Display As Array dialog, which lets you specify the start and length of the array. |
| Edit Register Group | Opens the Register Group dialog to edit the selected register group. |
| Enable | Enables the selected register. |
| Find | Opens the Find dialog, which lets you find specific elements within the view. |
| Find/Replace | Opens the Find/Replace dialog. |
| Format | Select a format type: Binary, Decimal, Natural, or hexadecimal. |
| Max Length | Opens the Configure Details Pane dialog, which lets you set the maximum number of characters to display. |
| Paste | Pastes the current clipboard content as text. |
| Remove Register Group | Removes the currently selected register group. |
| Restore Default Register Groups | Restores the original register groups. |
| Restore Original Type | Returns the selected register to the original type. |
| Select All | Selects all the content of the editor. |
| Wrap Text | Activate to wrap the text content within the visible area of the Details pane of the Registers view. |
You can modify the registers in the Registers view by changing their value and switching their number system.
To modify registers:
Once changed, the register value is highlighted in yellow.
|
Regardless of whether the value was changed, if you click OK, the register value is highlighted in yellow. |
To change the number system used to show the register values:
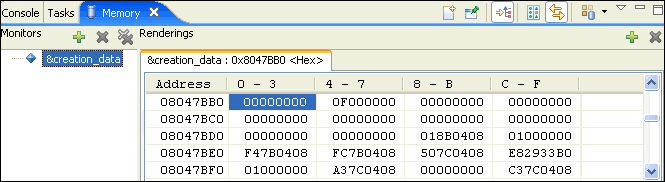
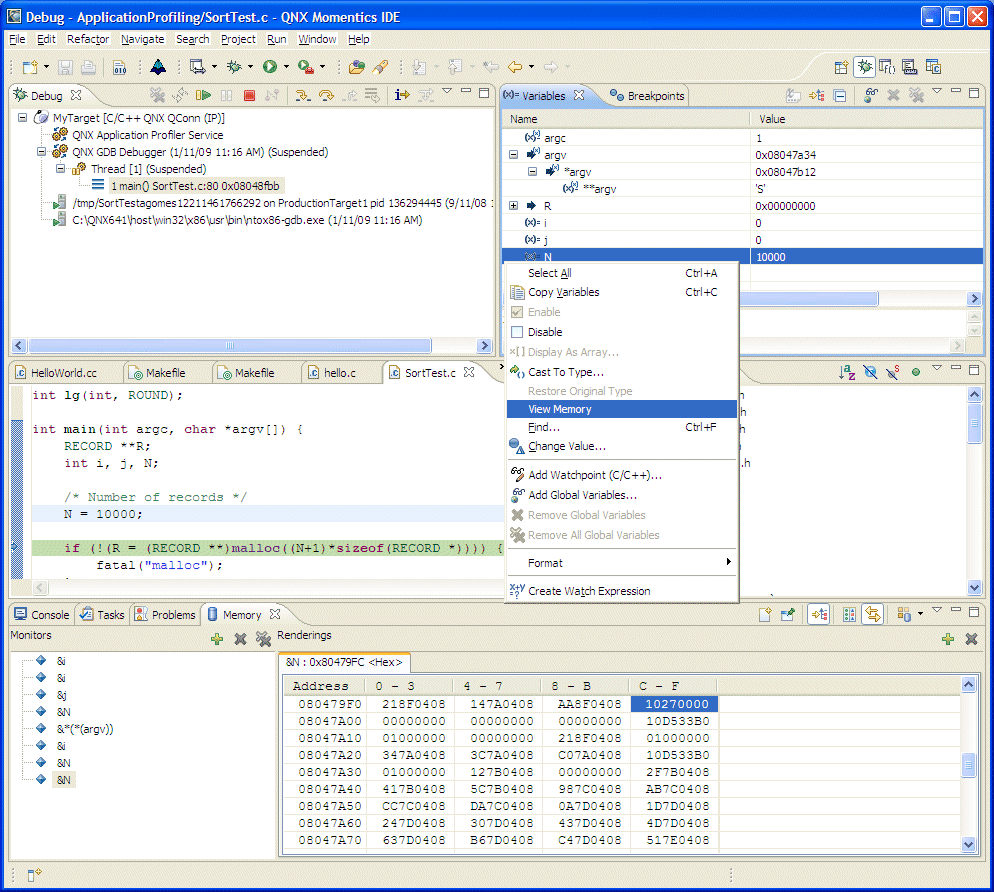
The Memory view lets you inspect and change your process's memory. To show this view, choose . The view is initially empty, but after you've added an item to monitor and specified the output format, this view will look something like this:
The Memory view.
|
QNX Neutrino uses a virtual-addressing model wherein each process has its own range of valid virtual addresses. This means that the address you enter into the Memory view must be a virtual address that's valid for the process you're debugging (e.g. the address of any variable). For more about QNX Neutrino's memory management, see the Process Manager chapter in the System Architecture guide. |
Viewing variables in memory.
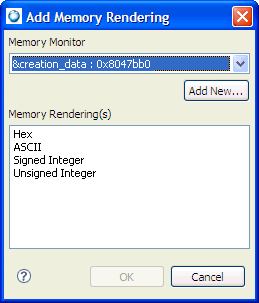
The Memory view lets you monitor and modify your process memory, shown as a list of memory monitors that are represented as a section of memory specified by its location, then referred as a base address. Each memory monitor can be shown in different predefined data formats, called memory renderings. The debugger supports the following rendering types: hexadecimal (default), ASCII, signed integer, and unsigned integer. The default rendering is displayed automatically on the monitor creation.
The left pane of the Memory view is the Memory Monitors pane, which contains the list of memory monitors added to the debug session currently selected in the Debug view. The right pane of the Memory view is the Memory Renderings pane, and its content is controlled by your selection in the Memory Monitors pane. It consists of the tabs that show renderings.
The Go To Address field lets you enter a memory address to locate the source line or assembly code for the symbol.
![]()
|
For Windows host only, if the following error is displayed in the Memory view: Target request failed: Unable to read memory. turn off the automatic buffering option that causes the IDE to read memory beyond the accessible area:
|
The Memory view supports the same addressing as the C language. You can address memory using expressions such as 0x0847d3c, (&y)+1024, and *ptr.
To inspect the memory of a process:
You can show memory in hexadecimal or ASCII, or as signed or unsigned integers:
To change a process's memory:
The changed memory appears in red.
|
Changing a process's memory can make your program crash. |
The Memory view toolbar icons include:
| Icon | Command | Description |
|---|---|---|
| New Memory View | Create a new memory view. | |
| Pin Memory Monitor | Select to pin the memory monitor on top of all other memory monitors. | |
| Toggle Memory Monitors Pane | Show/hide the Memory Monitor pane. | |
| Toggle Split Pane | Toggle the Memory Renderings pane split. | |
| Link Memory Rendering Panes | Synchronize the selection of two memory renderings. | |
| Switch Memory Monitor | When more than one memory monitor is active, select a different memory monitor to view. | |
| Switch the Monitors and Rendering panes display between horizontal and vertical orientation. | ||
| Opens the Preferences window allowing you to set options.
Click: Reset Memory Monitor — to set or reset only visible or all renderings when resetting a memory monitor. Padded String — enter strings to show memory that is not retrievable. Select Codepages — specify the standard to use to convert memory to ASCII and EBCDIC strings. |
||
| Specify the memory loading mode to use when rendering scrolls to the end of the buffer. |
The Monitors pane context menu commands for the Memory view include:
| Command | Description |
|---|---|
| Add Memory Monitor | Adds a new memory address or variable to the Memory Monitors pane. |
| Remove Memory Monitor | Removes the selected memory address or variable from the Memory Monitors pane. |
| Reset | Resets the currently selected memory monitor view. |
The Rendering pane context menu inside the Memory view includes:
| Command | Description |
|---|---|
| Add Rendering | Add a memory rendering pane to show a memory monitor item at a different address, or in a different format. |
| Remove Rendering | Remove the selected rendering from the Memory view. |
| Reset To Base Address | Reset the Rendering pane to the original base address. |
| Go To Address | Open a text box to specify a memory address. Press Enter to go to that address and show it in the Rendering pane. |
| Resize to Fit | Adjust the size of the columns to fit the size of the data being shown in the Memory view. |
| Show/Hide Address Column | Toggle the display of the Address column in the memory view. |
| Format | Open a dialog to specify column and row format. |
| Copy To Clipboard | Copy the selected portion of the Rendering pane to the clipboard. |
| Properties | Open the properties for the selected item. |
| Add Watchpoint | Open a dialog to set a watchpoint that will stop the program's execution whenever the value of an expression changes. Watchpoints are event-specific and take effect whenever a specified condition is true. |
The Modules view shows you information about the shared libraries for the session you select in the Debug view. The view shows the name, base address, and size of each library. To show this view, choose .
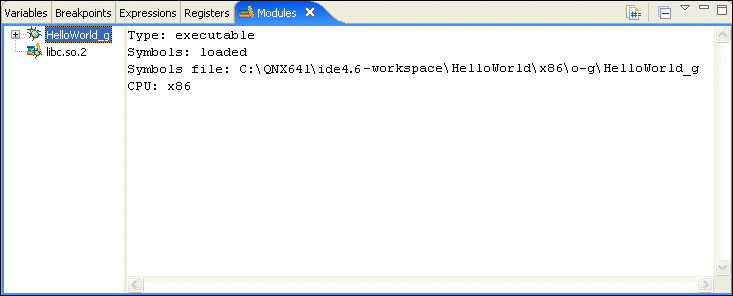
The Modules view: the shared libraries for the selected session.
The Signals view provides a summary of how your debugger handles signals that are intercepted before they're received by your program. To show this view, choose .
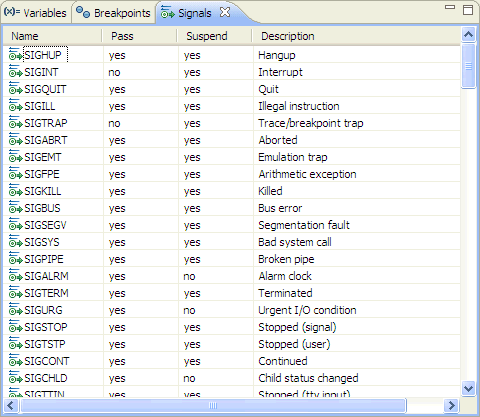
The Signals view.
The view contains the following fields:
To change how the debugger handles a signal:
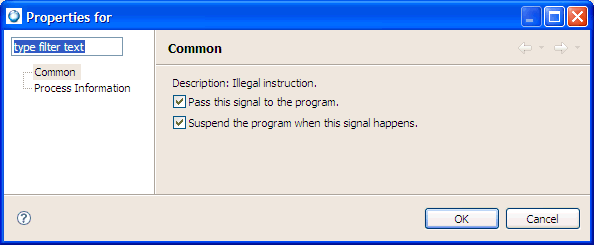
Check Suspend the program when this signal happens to suspend the program when it receives this signal. Uncheck it to let the program handle the signal as it normally would.
To send a signal to a suspended program:
|
You can see a thread-by-thread summary of how your program handles signals using the Signal Information view. To learn more, see the “Mapping process signals” section in the Getting System Information chapter. |
The Console view shows you the output of the execution of your program and lets you supply input to your program:
The Console view shows program output execution.
The console shows three different kinds of text, each in a different default color:
|
If you're connecting to your target via qconn, your process's output all appears in the same color because qconn combines standard output and standard error into one stream. |
You can choose different colors for these kinds of text on the preferences pages.
To access the Console view's customization dialog:
You can have more than one Console view, which is useful if you're working on more than one application at once:
Remember that you can copy data from the console and paste it elsewhere.
The IDE lets you use a subset of the commands that the gdb utility offers:
The Console view: GDB.
To learn more about the gdb utility, see its entry in the Utilities Reference and the Using GDB appendix of the Neutrino Programmer's Guide.
The QNX GDB Console view is part of the regular Console perspective. It appears as soon as the data is sent to it.
To switch to the QNX GDB Console view:
The Console view changes to the QNX GDB Console view.
The QNX GDB Console view lets you bypass the IDE and talk directly to GDB; the IDE is unaware of anything done in the QNX GDB Console view. Items such as breakpoints that you set from the QNX GDB Console view don't appear in the C/C++ editor.
|
You can't use the Tab key for line completion because the commands are sent to GDB only when you press Enter. |
The Console view: using with GDB.
|
To enter commands, you must be on the last line of the Console view. |
JTAG debuggers use pins to write an image directly into RAM, setting the machine to the start address, and then resuming the processor. The launch configurations for a JTAG device let you select which image to use (the supported types are ELF and SRecord).
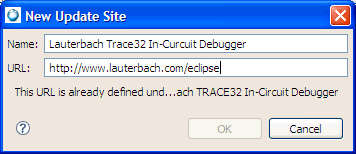
The QNX Momentics IDE supports the Abatron BDI2000 Debugger, the Lauterbach Trace32 In-Circuit Debugger, and the Macraigor Usb2Demon Debugger. Each of these debuggers (each of which has an associated launch configuration type) writes a QNX Neutrino image directly into RAM in a slightly different way:
These launch configuration types are used for JTAG debugging in the IDE:
In the IDE, the Debug perspective includes buttons to control the processor state through the JTAG device. These buttons start, reset, and halt the device, and link to the corresponding GDB commands for the Abatron and Macraigor devices, and the corresponding PRACTICE command for the Lauterbach Trace32 Debugger.
The Lauterbach Trace32 In-Circuit Debugger plugin don't include a Debug perspective; it launches its own Trace32 software that contains its own buttons for performing actions.
The Abatron BDI2000 JTAG Debugger supports various architectures and connector types, as well as providing GDB Remote Protocol support. The BDI2000 device enhances the GNU debugger (GDB), with JTAG debugging for various targets with the IDE.
To use the features of this JTAG Debugger with the IDE, you'll need to go through the process of installing, configuring, and using the Abatron BDI2000 JTAG Debugger with a QNX Neutrino kernel image.
The following topics describe the steps necessary to debug an IPL and startup for a BSP:
Before you begin to install, configure, and use the Abatron BDI2000 Debugger, you'll need to verify that you have the following required hardware and software:
For the list of supported target boards for Abatron, see the Abatron website at:
http://www.abatron.ch/products/debugger-support/gnu-support.html
The following Abatron configuration files, register definitions, and supporting documentation files are also available after you log on to Foundry27 at:
http://community.qnx.com/sf/frs/do/viewRelease/projects.internal_tools/frs.jtag_utilities.abatron_configuration_files
The Abatron BDI2000 JTAG Debugger enhances the GNU debugger with JTAG debugging for various targets.
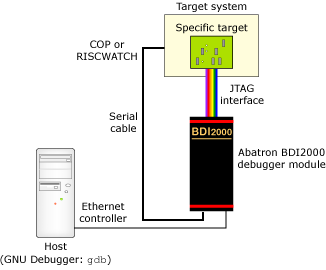
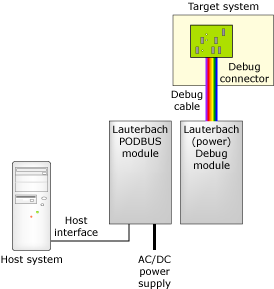
The following illustration shows how the Abatron BDI2000 JTAG Debugger is connected to your host:
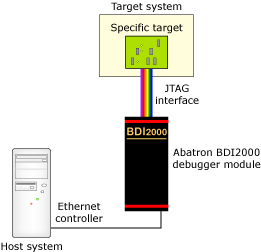
Architecture for connecting the Abatron BDI Debugger to your host machine.
The BDI2000 box implements the interface between the JTAG pins of the target CPU and the Ethernet connector. Later, you'll install the specific Abatron firmware, and configure the programmable logic of the BDI2000 Debugger device.
To physically connect the Abatron BDI2000 Debugger to your host machine:
|
Don't connect a JTAG debug cable into the Abatron BDI2000 Debugger. The debugger shouldn't be connected to the target until after you've updated the Abatron firmware for that architecture. |
|
The flash memory of the Abatron BDI2000 JTAG Debugger stores the IP address of the debugger as well as the IP address of the host, along with the configuration file and the name of the configuration file. Every time you turn on the Abatron BDI2000 JTAG Debugger, it reads the configuration file using TFTP (TFTP is included with the software). |
After you've received Abatron firmware (or downloaded it from the QNX website), you'll update the internal firmware of the Abatron BDI2000 debugger to deal with the target architecture for your specific requirements.
To update the Abatron firmware:
You'll see this bdiGDB window.
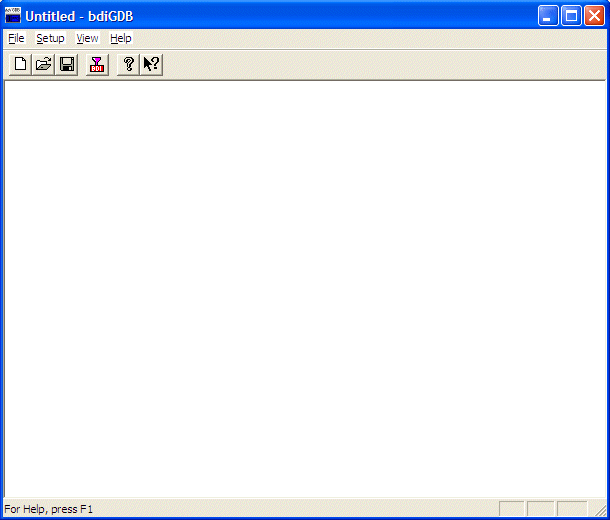
The Abatron bdiGDB window.
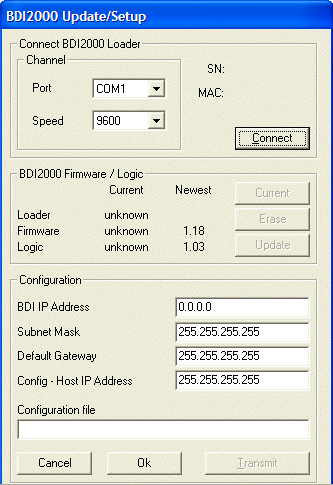
The DBIGDB setup window.
If the Update button wasn't enabled, then the BDI2000 module already contained the latest version of the Abatron firmware for your target architecture.
For example, for an MPC8349EQS target board, use the full path to the mpc8349e.cfg file. If your target board doesn't have a corresponding .cfg file, contact Abatron to provide you with the latest files for your hardware.
After a few seconds, you should receive the message “Transmit passed.”
After you upload the firmware to the BDI200 module (previously, you used a serial line communication, which is used only for the initial configuration of the BDI2000 Debugger system, the host is then connected to the BDI20000 through the serial interface (using one of COM1 through COM4).
The following illustration shows how the Abatron BDI2000 JTAG Debugger is connected between the host and the target for debugging purposes:
Architecture for connecting the Abatron BDI2000 Debugger to your target machine.
To physically connect the Abatron BDI2000 to your target board:
Remove the serial cable from the BDI2000 and your host machine; you need it only for the firmware update.
Next, you can use the QNX Momentics IDE to build an image file that can be loaded onto the target board, and debugged by the Abatron BDI2000 Debugger.
To build a system image:
http://community.qnx.com/sf/wiki/do/viewPage/projects.bsp/wiki/BSPAndDrivers
Ensure that you download a version of the BSP installer appropriate for your host machine as well.
Note that a .srec or .elf image file will be uploaded straight to the target board's RAM through the JTAG pins.
Occasionally, you might have to specify a -O0 in the Other Options field in order to overwrite the macros defined, which could contain optimization. Click OK, and when prompted to rebuild the C++ project, click Yes and wait for the build to finish.
400280 d188 403960 --- startup-bios.sym
Or something like this:
200280 10188 202244 --- startup-mpc8349e-qs.sym
|
The exact numerical values and filename will differ; however, you want to focus on the line ending with .sym. Take note of the first and third numerical values on this line, as you'll need them later. |
Now, in the System Builder Projects view, if you expand the Images directory, it should contain an .elf file and a .sym file. This is the Neutrino image that is ready to be uploaded and debugged. However, before you can continue with the debugging process, you'll need to create a launch configuration.
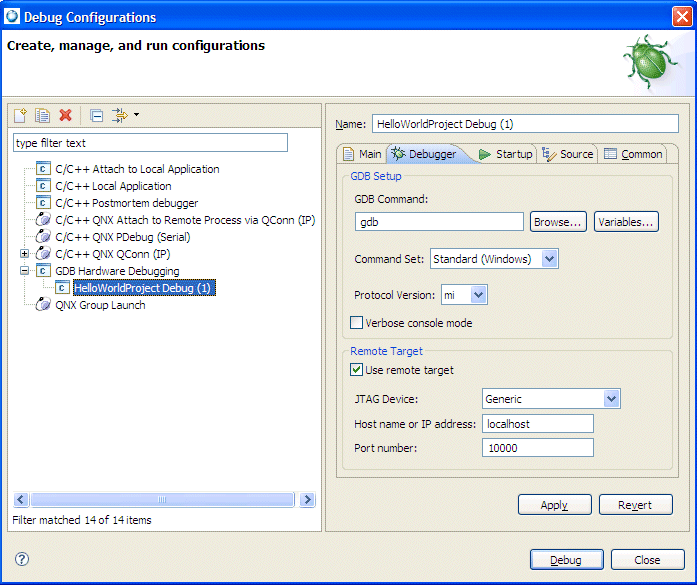
To begin debugging using the Abatron BDI2000 JTAG Debugger, you'll need to create a debug configuration in the QNX Momentics IDE to upload an image into the target board's RAM, and debug it through the JTAG pins.
To create a launch configuration for the Abatron BDI2000 Debugger:
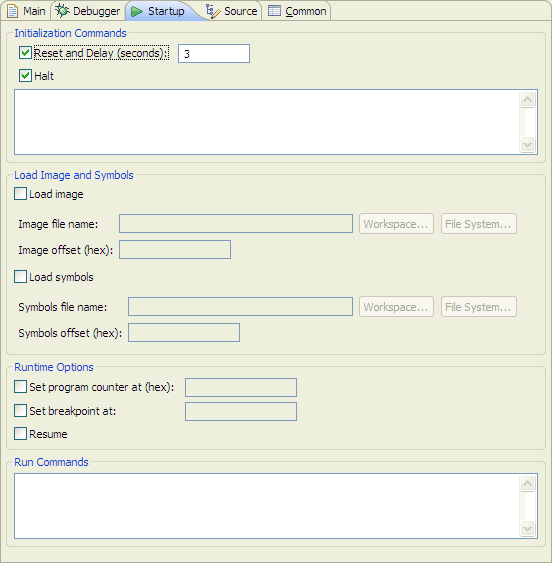
Since just about every board loaded with a U-Boot, IPL, or a ROM Monitor needs to wait a few seconds for the prompt before halting the processor to send the image, a delay of 3 seconds is sufficient for waiting between resetting the board and starting to load the image.
The symbols file provides symbols for source-level debugging. For most BSPs, the symbol file has the same filename as the image file, except for the file extension (.sym). Note that the IDE would issue a warning message if you didn't build the image with debug symbols. Leaving this textbox blank would result in no debug symbols being loaded, resulting in assembly-level debugging only.
Each of these two textboxes (the Symbols file name and the Symbols offset (hex))is paired with a Symbol offset field. In the case of .elf files, the offset for the image can be parsed from the binary itself; you'll need to manually specify the offset by looking at the BSP-provided value.
Using the Debug perspective from the QNX Momentics IDE, you can debug the startup binary of the Neutrino image.
To debug the startup binary:
The first thing you will notice is that the target board has been automatically restarted. After waiting a certain number of seconds as specified in the Reset and Delay (seconds) checkbox on the Startup tab of the Debug launch configuration, the QNX Momentics IDE will begin uploading the image to the target through the JTAG pins.
After the image has been successfully uploaded, startup will commence until it hits a breakpoint.
Once the IDE encounters a breakpoint, you will see several things at once. In the top-left portion of the Debug perspective, you will see a stack trace for the current location of the code.
In your debug results, it might appear to be more shallow than the stack traces that you would typically see because the code is not running in a complicated environment, but rather directly on the hardware.
You can use the Registers view to expand and show all of the processor registers on your target board, and their contents over time. While stepping through, register rows will change color to indicate a changed value.
You can also select the Variables tab to view the value of local and global variables for which symbols exist, and you'll see the Code view and Disassembly view. The Disassembly view will incorporate the source code into its display, allowing you to easily see which machine instructions correspond to which lines of code.
Once you've finished your debugging session, you should remove all breakpoints and click Continue to let startup finish booting up. A quick look at the serial console will show a fully-booted Neutrino image.
The following topics discuss the process of installing, configuring, and using the Lauterbach Trace32 In-Circuit Debugger with a QNX Neutrino kernel image, as well as describing the steps necessary to debug using the Debugger:
|
Currently, the Lauterbach TRACE In-Circuit Debugger doesn't integrate with gdb. The JTAG integration in the IDE is limited to source-level debugging of the source code only. Since the Lauterbach Trace32 In-Circuit Debugger doesn't support Linux or Neutrino hosts, your host must run with Microsoft Windows. The proper powering-up/down sequence is to power up the debugger first, and then the target, and the powering-down sequence is to power down the target, and then the debugger. When prompted to specify a directory location, if you don't want to use the default directory specified, we recommended that you not use the system directory itself. The IDE contains built-in support for the Abatron BDI2000 and Macraigor USB2Demon JTAG devices, with other device support through self-defined hardware-specific command sets. The JTAG debug launch configuration supports GDB Hardware Debug through the JTAG interface. |
For more information about the Lauterbach Trace32 In-Circuit Debugger, see the Lauterbach documentation and refer specifically to the ICD Debugger User's Guide, ICE User's Guide, and ICE User's Guide. Descriptions for all of the general commands are found in the IDE Reference Guide and General Reference Guide.
Before you begin to install, configure, and use the Lauterbach Trace32 In-Circuit Debugger, you'll need to verify that you have the following required hardware and software:
|
Since the Lauterbach Trace32 In-Circuit Debugger doesn't support Linux or Neutrino hosts, your host must run with Microsoft Windows. |
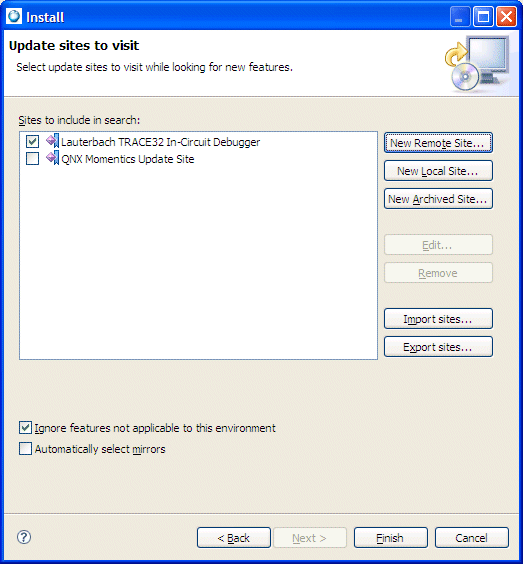
Once you've verified that you have the correct hardware and software, you're ready to install the Lauterbach Trace32 In-Circuit Debugger software onto your host development machine.
To install the Lauterbach Trace32 In-Circuit Debugger software:
Now, you are ready to continue with installing the Lauterbach Trace32 Eclipse plug-in software.
The Lauterbach Trace32 Eclipse plug-in software links the IDE and the Trace32 Debugger; it provides the connection between both development environments. The plugin adds a launch configuration to the IDE that you can use to start existing Trace32 installations; however, it doesn't let you use Trace32 debug functionality from within the IDE, such as using watch variable values, or using the step and go functionality.
To install the Lauterbach Trace32 Eclipse plug-in software:
Now, the Lauterbach Trace32 Debugger appears in the list of configuration types.
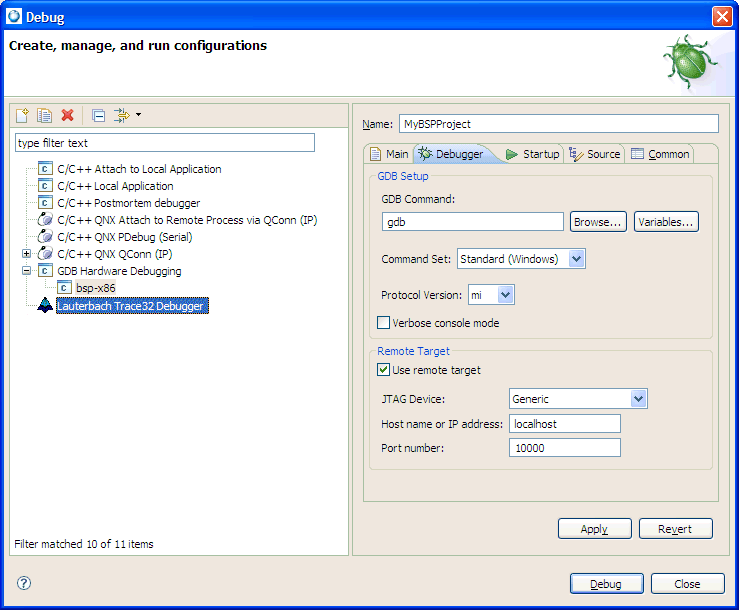
The Lauterbach Trace32 Debugger launch configuration type.
In addition, the Lauterbach Trace32 In-Circuit Debugger icon is added to the Toolbar. You can use this icon to conveniently launch the Lauterbach CMM PRACTICE script from the latest open launch configuration dialog.
![]()
The Lauterbach Trace32 CMM icon.
Now, you want to physically connect the Debugger to the target hardware.
The Lauterbach architecture.
To connect the Lauterbach Trace32 In-Circuit Debugger to the target hardware:
The Ethernet Controller should have a PODBUS OUT female port, and the Debug Interface should have a PODBUS In male port. Connect these two hardware components together through this port.
Next, you want to configure the target hardware for the Lauterbach Trace32 In-Circuit Debugger for use with QNX Momentics IDE.
To configure the target hardware:
where:
RCL=NETASSIST

PACKLEN=1024

PORT=20006
|
Ensure that you include a blank line before the first line, after the last line, and in between each of the lines. |
Now, your Lauterbach Trace32 In-Circuit Debugger is connected to the target hardware. Next, you are ready to create a launch configuration.
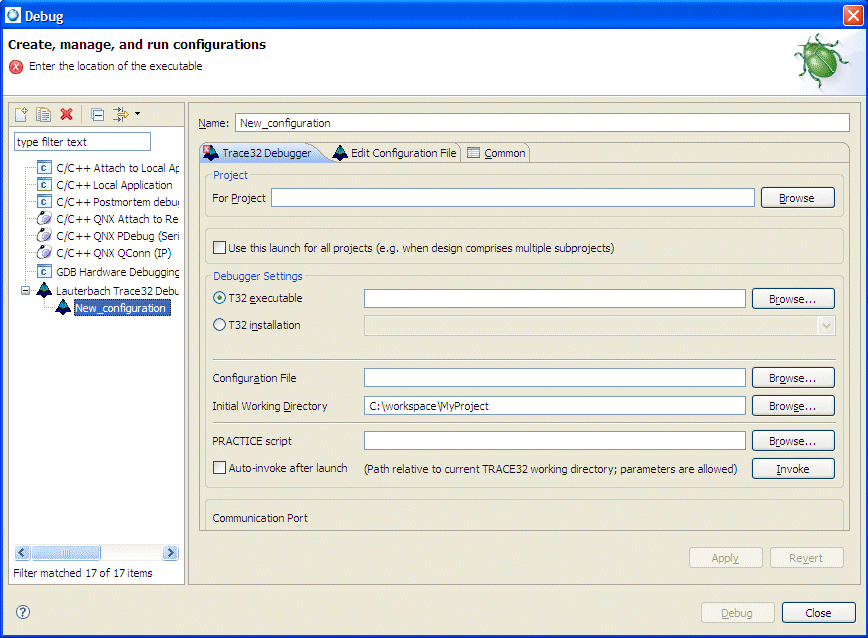
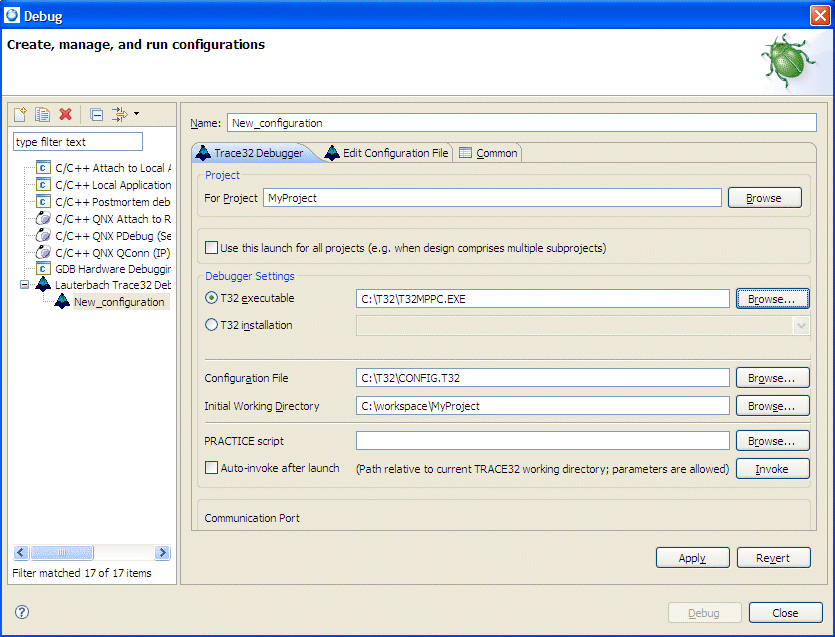
Earlier, you installed the Lauterbach Trace32 In-Circuit plugin to start the Trace32 Powerview using the QNX Momentics IDE launch configurations. To create a launch configuration:
|
It is mandatory to have a project to use the Lauterbach Trace32 In-Circuit Debugger plugin. Breakpoint synchronization and edit-source functionality work only with files contained in a project; otherwise, the plugin doesn't know which Trace32 instance it belongs to. |
The Lauterbach Trace32 In-Circuit Debugger launch configuration type contains these tabs: the Trace32 Debugger, Edit Configuration File, and Common.
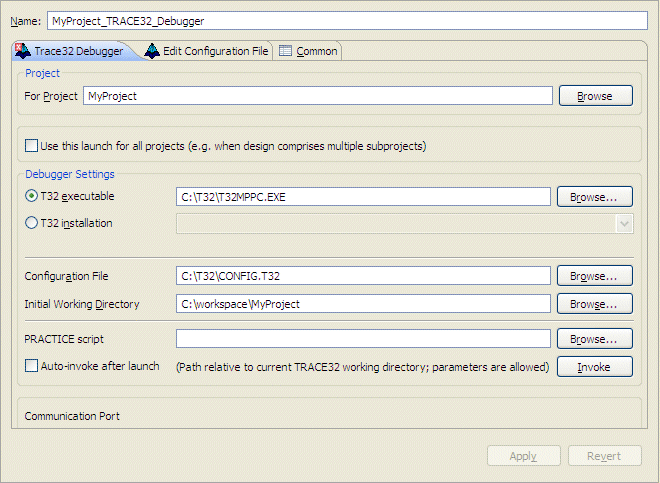
By default, the Trace32 installation process will have located the executable in the folder c:\T32; however, the executable depends on your target architecture (e.g. T32MARM.EXE for ARM, T32MPPC.EXE for PPC).
After specifying the configuration file, you may conveniently edit this file on the Edit configuration File tab.
<- mandatory empty line
RCL=NETASSIST
PACKLEN=1024
Eclipse Plugin for Coupling with TRACE32 6 Creation of Launch Configurations
PORT=20006
<- mandatory empty line
This configures Trace32 to accept commands via the built-in socket API which is a prerequisite for connecting with the plugin. Note that the port number used in the example (20006) is rather arbitrary, but must be unique among all concurrently active connections between Trace32 and the IDE and must not be used by other programs on the host. You don't need to configure the plugin; it will parse the chosen configuration file and extract the relevant parameters.
Next, you'll want to create a launch configuration for the target hardware. The following steps describe how to create a launch configuration for a C++ Project written for the target hardware.
To create a launch configuration:
You can create a startup script for the Trace32 Debugger software, which can bring up the target hardware and load the image into RAM.
To create a startup script:
Or:
sys.cpu _CPU_
where _CPU_ is your architecture. For example, sys.cpu MPC8349.
sys.reset
sys.up
go
wait 5000.ms
break
data.load._FORMAT_ _IMAGE
where:
step,
Data.List,
Register /SpotLight
For each of your cores, you'll need to create a separate project in the IDE because each core will execute its own specific application. For handling multicore systems, the launch configuration lets you select a master project from the Master Launch field on the Trace32 Debugger tab.
Whenever the master project starts, the associated slave projects are also launched to ensure the correct start order. The type of a launch configuration (master vs slave) is indicated in the top left corner of the launch configuration dialogue.
For information about creating more complicated launch configuration and using Trace32Start, see the Lauterbach documentation included with the software.
A typical use case is to implement a new feature inside the IDE and build the executable file. After the Trace32 launch configuration starts, through the use of a PRACTICE script, it automatically downloads the modified binary to the target.
The program is then started and debugged inside the Trace32 Debugger. When an error is detected and its location identified, you can right-click inside any window with source code and select Edit source to return to the IDE. The IDE will open the requested file and position the cursor on the correct line.
After you correct the error, you can set a breakpoint at the same location from within IDE (see “Using breakpoints and watchpoints”). The breakpoint is communicated to the TRACE32 Debugger. After rebuilding and reloading the program, you can restart it again; the processor will stop at the breakpoint you set earlier.
As is common for IDE-based projects, all source code needs to be organized within projects. If a source file isn't part of a project, the plugin can't communicate breakpoints, or provide the required functionality.
If you need to change the IP address, add a static arp entry on the Windows host:
arp -s ip-addr 00-C0-8A-80-42-23
And edit the NODE=ip-addr line in c:\t32\config.t32 before running t32w95.exe.
To obtain basic access:
sys.reset
sys.up
go
FLASH.RESET
FLASH.Create 1. 0xFF800000--0xFF80FFFF 0x02000 AM29LV100B Byte
FLASH.Create 1. 0xFF810000--0xFFFEFFFF 0x10000 AM29LV100B Byte
FLASH.Create 1. 0xFFFF0000--0xFFFFFFFF 0x02000 AM29LV100B Byte

flash.erase 0xfff00000--0xfff1ffff
flash.program 1.
data.load h:\ipl.bin   # SREC Format
flash.program
The Trace32 debugger software uses a simple startup script in the Lauterbach scripting language called PRACTICE. The software includes a few PRACTICE scripts to boot some boards in common use at QNX. The file called T32.CMM is available from:
http://community.qnx.com/sf/frs/do/viewRelease/projects.ide/frs.ide.jtag_utilities
;Default startup program for TRACE32
;
;This startup program can be modified according to your needs.

;choose hex mode for input
 radix hex

;Add some extra buttons to the toolbar

 menu.rp
 (
  add
  toolbar
  (
   separator
   toolitem "Source/List" "list" "Data.List"
   toolitem "Memory Dump" "dump" "Data.dump"
   toolitem "Register" "reg" "Register /SpotLight"
   separator
   toolitem "Watch" ":var" "Var.Watch"
   toolitem "Stack" ":varframe" "Var.Frame /l /c"
   toolitem "Automatic Watch" ":varref" "Var.Ref"
   separator
   toolitem "List Breakpoints" "break" "Break.List"
   toolitem "List Symbols" "symbols" "sYmbol.Browse"
   separator
  )
 )

;Recall and Define History File
 autostore , history

 enddo
The Macraigor JTAG debugger allows a host computer to control and debug an embedded target processor. Through the process of installing, configuring, and using the Macraigor Usb2Demon Debugger with a QNX Neutrino kernel image, you'll be able to write the image directly into RAM
The following topics discuss the process of installing, configuring, and using the Macraigor Usb2Demon Debugger with a QNX Neutrino kernel image, as well as describing the steps necessary for debugging using the Macraigor debugger:
Before you begin to install, configure, and use the Macraigor Usb2Demon Debugger, you'll need to verify that you have the following required hardware and software:
For the list of supported target boards for Macraigor, see the Macraigor website at http://www.macraigor.com/cpus.htm.
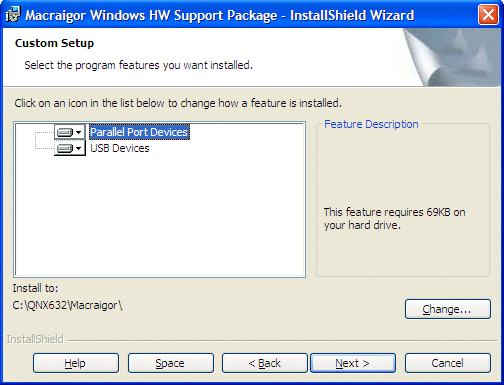
To install the hardware support package:
For detailed information about using the Macraigor JTAG/BDM devices and GNU Tools, see Using Macraigor JTAG/BDM Devices with Eclipse and the Macraigor GNU Tools Suite on Windows and Linux Hosts.
Now, you want to physically connect the Macraigor Usb2Demon Debugger to your host machine.
Connect one end of the provided USB cable into the Usb2Demon device, and the other end into a USB port on your host machine. If all of the required software has already been installed, Windows should recognize it as a Macraigor device, and the green LED on the Usb2Demon should come on.
Connect the JTAG cable into the JTAG port of your target machine. The JTAG port may also be labeled COP or RISCWATCH, depending on the hardware.
|
After you've connected the device to the board and to your host machine, you have to install the Macraigor USB driver when Windows recognizes a new USB device. To verify that the Macraigor device is recognized by the Windows host, run the UsbDemon Finder utility included with the software. This utility is available by double-clicking the following icon on your desktop:
In addition, run the JTAG Scan Chain Analyzer utility. This utility is available by double-clicking the following icon on your desktop:
Select Usb2Demon from the dropdown list, click the Analyze Scan Chain button. You'll see the output for the JTAG ID and probable CPU type. |
After connecting the device to the board and to your host machine, you need to start OCDremote listening on a local port for incoming GDB client connections. OCDremote is a server that translates incoming gdb commands into instructions understood by the JTAG device.
To start the OCD remote, obtain the appropriate flags for your JTAG device, USB port, and target board. A complete reference can be found in Appendix A of the Using Macraigor JTAG/BDM Devices with Eclipse and the Macraigor GNU Tools Suite on Windows Hosts documentation from Macraigor.
For example, you can start the OCDremote utility at the command prompt for the Power PC by using the following command:
-c ppc405 -d usb -s 2
You'll notice that GDB is bound to port 8888.
As an external tool, or from the command line, start OCDremote on a local port.
Next, you can use the QNX Momentics IDE to build an image file that can be loaded onto the target board, and be debugged by the Macraigor Usb2Demon Debugger.
To build a system image:
http://community.qnx.com/sf/wiki/do/viewPage/projects.bsp/wiki/BSPAndDrivers.
Ensure that you download a version of the BSP installer appropriate for your host machine.
Occasionally, you might have to specify a -O0 in the Other Options field in order to overwrite the macros defined, which could contain optimization. Click OK, and when prompted to rebuild the C++ project, click Yes and wait for the build to finish.
400280 d188 403960 --- startup-bios.sym
Or:
200280 10188 202244 --- startup-mpc8349e-qs.sym
|
The exact numerical values and filename will differ, but it will be the only line ending with .sym. Take note of the first and third numerical values on this line, as you'll need them later. |
Now, in the System Builder Projects view, expand the Images directory; it should contain an .elf file and a .sym file. This is the Neutrino image that is ready to be uploaded and debugged. However, before you can continue with the debugging process, you'll need to create a launch configuration.
To begin debugging using the Macraigor Usb2Demon Debugger, you need to create a debug configuration in the QNX Momentics IDE to upload an image into the target board's RAM, and debug it through the JTAG pins.
To create a launch configuration:
Since just about every board loaded with a U-Boot, IPL, or a ROM Monitor needs to wait a few seconds for the prompt before halting the processor to send the image, a delay of 3 seconds is sufficient for waiting between resetting the board and starting to load the image.
The symbols file provides symbols for source-level debugging. For most BSPs, the symbol file has the same filename as the image file, except for the file extension (.sym). Note that the IDE would have issued a warning message if you didn't build the image with debug symbols. Leaving this textbox blank would result in no debug symbols being loaded, resulting in assembly-level debugging only.
Each of these two textboxes (the Symbols file name and the Symbols offset (hex) is paired with a Symbol offset field. In the case of .elf files, the offset for the image can be parsed from the binary itself; you'll need to manually specify the offset by looking at the BSP-provided value.
Using the Debug perspective from the QNX Momentics IDE, you can debug the startup binary of the Neutrino image created earlier.
To debug the startup binary:
The first thing you'll notice is that the target board has been automatically restarted. After waiting a certain number of seconds as specified in the Reset and Delay (seconds) checkbox on the Startup tab of the Debug launch configuration, the QNX Momentics IDE will begin to upload the image to the target through the JTAG pins.
After the image has been successfully uploaded, startup will commence until it hits a breakpoint.
Once the IDE encounters a breakpoint, you'll see several things at once. In the top-left portion of the Debug perspective, you will see a stack trace for the current location of the code.
In your debug results, it might appear to be more shallow than the stack traces that you would typically see because the code isn't running in a complicated environment, but directly on the hardware.
Once you've finished your debugging session, you should remove all breakpoints and click Continue to let startup finish booting up. A quick look at the serial console will show a fully-booted Neutrino image.
Mudflap provides runtime pointer checking capability to the GNU C/C++ compiler (gcc). It adds runtime error checking for pointers that are typically the cause for many programming errors in C and C++. Since Mudflap is included with the compiler, it doesn't require any additional tools in the tool chain, and it can be easily added to a build by specifying the necessary GCC options (see “Configuring Mudflap to find errors.)”
Mudflap instruments all of the risky pointer and array dereferencing operations, some standard library string/heap functions, and some other associated constructs with range and validity tests. Instrumented modules will detect buffer overflows, invalid heap use, and some other classes of C/C++ programming errors. The instrumentation relies on a separate runtime library (libmudflap), which will be linked into a program when the compile option (-fmudflap) and linker option (-lmudflap) are provided for the build.
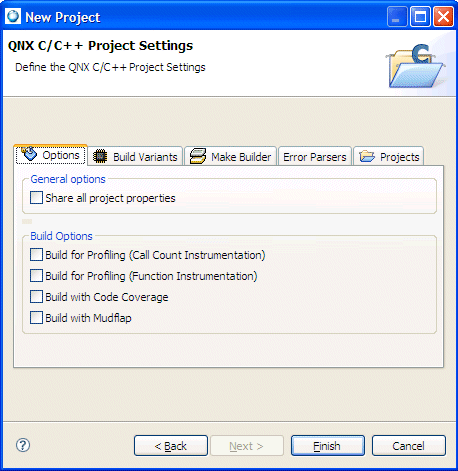
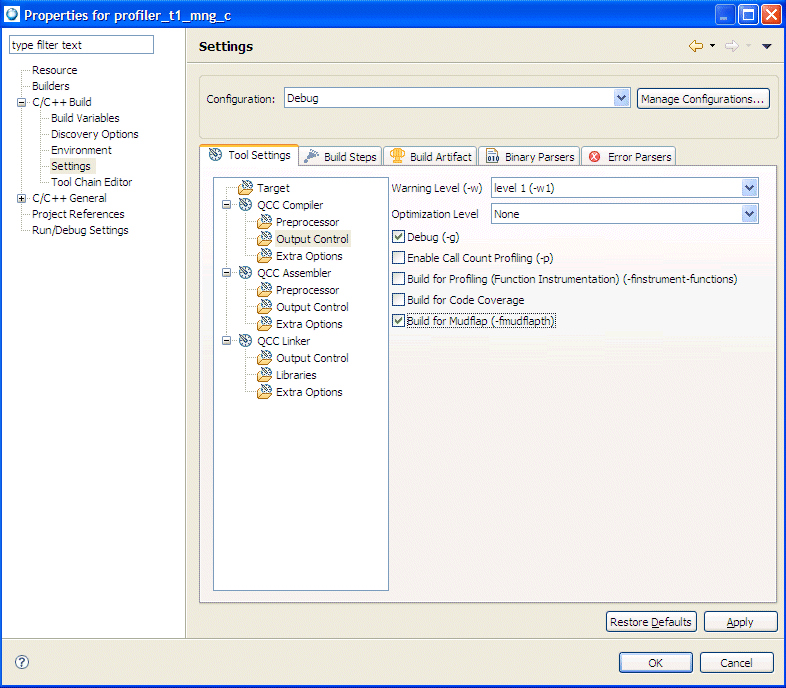
The use of Mudflap requires GCC with Mudflap support (GCC 4.x with the Mudflap enabled flag and appropriate configuration settings (see “Configuring Mudflap in the IDE”.) Once configured, the IDE adds options to the Makefile: -lmudflap to LD_SEARCH_FLAGS and -fmudflap to CFLAGS1.
|
Since Mudflap slows down your application, ensure that you disable Mudflap during your final compilation. |
Many runtime errors in C and C++ are caused by pointer errors. The most common reason for this type of error is that you've incorrectly initialized or calculated a pointer value and attempted to use this invalid pointer to reference some data. Since all pointer errors might not be identified and dealt with at runtime, you might encounter a situation where you go over by one byte (off-by-one error), which might run over some stack space, or write into the memory space of another variable. You don't always detect these types of errors because in your testing, they don't typically cause anything to crash, or they don't overwrite anything significant. An off-by-one error might become an off-by-1000 error, and could result in a buffer overflow or a bad pointer dereference, which may crash your program, or provide a window of opportunity for code injection.
Mudflap adds another pass to GCCs compiler sequence to add instrumentation code to the resulting binary that encapsulates potentially dangerous pointer operations. In addition, Mudflap keeps a database of memory objects to evaluate any pointer operation against a known list of valid objects. At runtime, if any of these instrumented pointer operations is invalid or causes a failure, then a violation is emitted to the stderr output for the process. The violation specifies where the error occurred in the code, as well as what objects where involved.
|
You don't have to use Telnet or a serial terminal window to obtain output from Mudflap. Although it is available from the Command line, you can choose to monitor the stdout or use it directly from within the IDE. The IDE also includes a build integration that let's you select Mudflap as one of build variant build options. |
The IDE includes a QNX launch tool that enables you to parse Mudflap errors (such as buffer overflow on the stack or heap, or of a pointer, all the way to the target), and the errors display similar to that of the Memory Analysis Tool. For example, during the Mudflap launch, the IDE creates a Mudflap session, and then you can select an item to view the errors in the source code.
For example, if you specify the following code:
#include <stdio.h>
#include <stdlib.h>
#include <string.h>

int a[10];
int b[10];

int main(void)  {
   return a[11];
}
In this example, the compiler will allocate memory for a and b, and consequently the access to a[11] will most likely read the value of b[1]. This type of access won't fail; however, the code isn't correct and will fail with Mudflap enabled, and generate the following output in the Console:
[Console output redirected to file:C:\ide-4.6-workspace\AQNXCProject\output.mudflap]
*******
mudflap violation 1 (check/read): time=1238531869.688193 ptr=0x80cbb20 size=48
pc=0xb8207da3 location=`C:/ide-4.6-workspace/AQNXCProject/AQNXCProject.c:9:4 (main)' thread=1
      libmudflapth.so.0(__mfu_check+0x456) [0xb8207c02]
      libmudflapth.so.0(__mf_check+0x3e) [0xb8207d9e]
      AQNXCProject(main+0x67) [0x8049103]
      libmudflapth.so.0(__wrap_main+0x41) [0xb8207659]
Nearby object 1: checked region begins 0B into and ends 8B after
mudflap object 0x80d5500: name=`C:/ide-4.6-workspace/AQNXCProject/AQNXCProject.c:5:5 a'
bounds=[0x80cbb20,0x80cbb47] size=40 area=static check=3r/0w liveness=3
alloc time=1238531869.688193 pc=0xb8207593 thread=1
number of nearby objects: 1
Leaked object 1:
mudflap object 0x80d5290: name=`malloc region'
bounds=[0x80d5248,0x80d525b] size=20 area=heap check=0r/0w liveness=0
alloc time=1238531869.686193 pc=0xb8207593 thread=1
      libmudflapth.so.0(__mf_register+0x3e) [0xb820758e]
      libmudflapth.so.0(__real_malloc+0xba) [0xb8208b6a]
      libc.so.3(atexit+0x19) [0xb032ac99]
      libc.so.3(_init_libc+0x33) [0xb03641b3]
Leaked object 2:
mudflap object 0x80d5360: name=`malloc region'
bounds=[0x80d5318,0x80d532b] size=20 area=heap check=0r/0w liveness=0
alloc time=1238531869.687193 pc=0xb8207593 thread=1
      libmudflapth.so.0(__mf_register+0x3e) [0xb820758e]
      libmudflapth.so.0(__real_malloc+0xba) [0xb8208b6a]
      libc.so.3(atexit+0x19) [0xb032ac99]
      AQNXCProject(_start+0x42) [0x8048fda]
Leaked object 3:
mudflap object 0x80d5430: name=`malloc region'
bounds=[0x80d53e8,0x80d53fb] size=20 area=heap check=0r/0w liveness=0
alloc time=1238531869.687193 pc=0xb8207593 thread=1
      libmudflapth.so.0(__mf_register+0x3e) [0xb820758e]
      libmudflapth.so.0(__real_malloc+0xba) [0xb8208b6a]
      libc.so.3(atexit+0x19) [0xb032ac99]
      AQNXCProject(_start+0x61) [0x8048ff9]
number of leaked objects: 3
These output results indicate that on line 9 AQNXCProject.c:9:4 in the project file myApplication.c, the code performed an incorrect read access with the variable named a (mudflap object 0x80d5500: name=`C:/ide-4.6-workspace/AQNXCProject/AQNXCProject.c:5:5 a').
The IDE will populate the Mudflap Violations view with the contents of Mudflap log file (specified in the Launch Configuration). It provides you with additional information about the violation(s) that Mudflap detected, from which you can select an item to view the error in the source code.
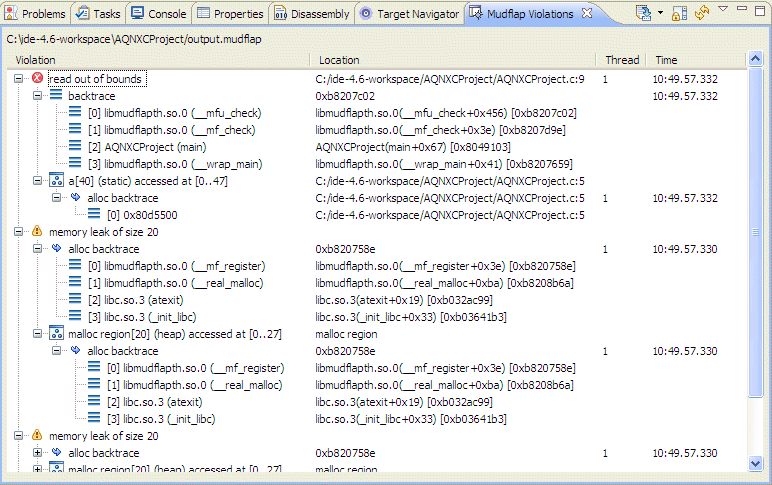
The top level of the main view shows the errors, and if you expand a particular violation, you'll receive information about nearby objects, a backtrace, similar errors, as well as other useful detailed information.
For detailed information about the results generated by Mudflap output, see “Mudflap Violations view” and “Interpreting Mudflap output.”
To use Mudflap in the IDE, you'll need to select Mudflap options to add the -fmudflap option to the compiler command line for your application. There is a runtime library attached to the process called libmudflap that is controlled by runtime options that are set using the environment variable MUDFLAP_OPTIONS. The instrumentation relies on this separate libmudflap runtime library that is linked into a program when the compile option (-fmudflap) and linker option (-lmudflap) are selected for the application.
|
There are many options available for violation handling, checking and tracing, heuristics, tuning, and introspection (introspection provides insight into the cause of the error). For more details about these options, see that paper located at:
http://gcc-uk.internet.bs/summit/2003/mudflap.pdf |
To configure Mudflap to help you identify errors in your code:
|
If your binary is instrumented with Mudflap, you can't run Memory Analysis on it because there will be a conflict (trying to overload the same functions), and it will cause the program to crash. |
The IDE displays a Mudflap options page that lists the options that this Mudflap-enabled application can run with.
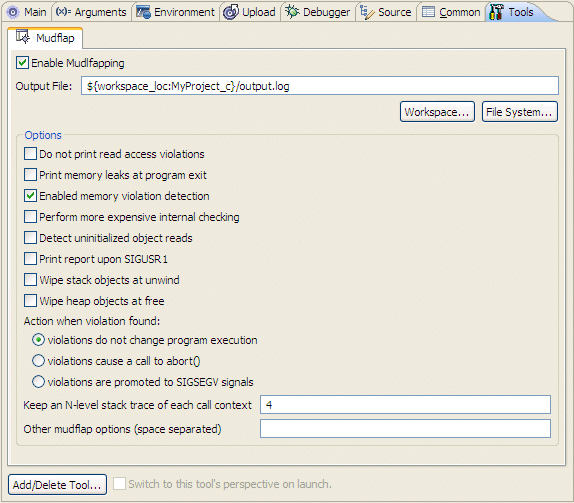
violations do not change program execution — Violations don't change the program execution. This means that this option will do nothing and the program may continue with the erroneous access; however, this action may corrupt its own state, or the state of libmudflap. The Mudflap option for this feature is -viol-nop.
violations cause a call to abort() — A call is made to the abort() function when a violation is encountered, which then requests a core dump and exit. The Mudflap option for this feature is -viol-abort.
violations are promoted to SIGSEGV signals — Generate a SIGSEGV, which a program may choose to catch. The Mudflap option for this feature is -viol-segv.
The Mudflap session opens and shows the Mudflap Violation view that contains any errors that it encountered (the errors are recorded in the Mudflap output log file).
For Mudflap, you can set the following additional options:
The Mudflap Violations view is populated based on the contents of Mudflap log file that you specified during the Launch Configuration setup. If the Mudflap log file is updated, the Mudflap Violation view automatically refreshes to reflect the modified data.
The Mudflap Violations view displaying data collected in the Mudflap log file.
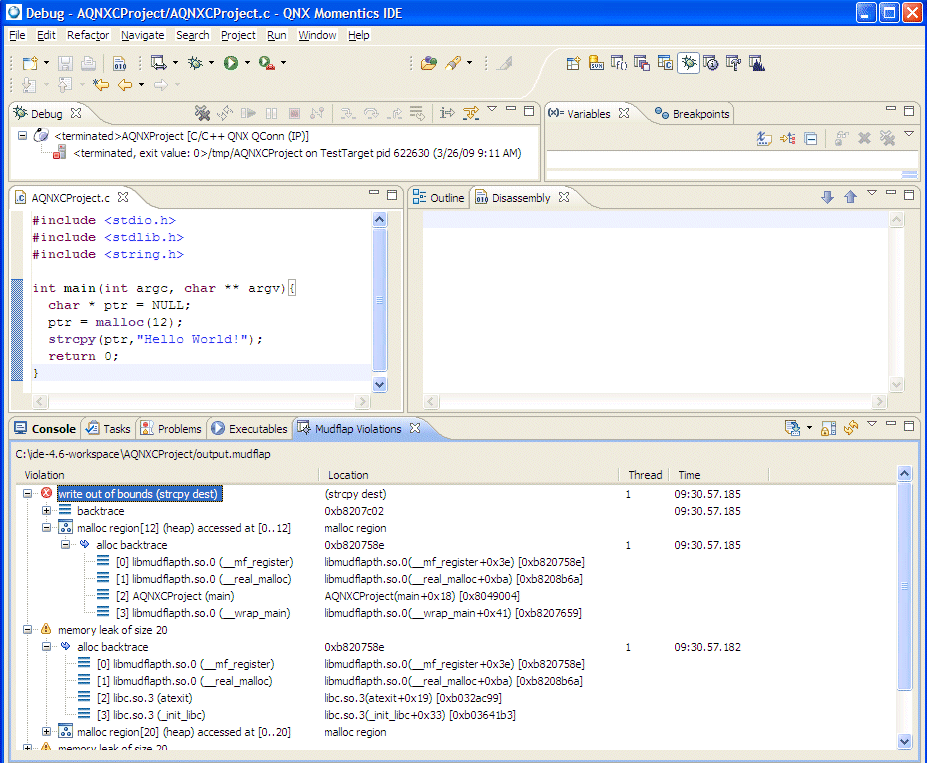
Since Mudflap provides pointer debugging functionality, including buffer overflow detection, leak detection, and reads to uninitialized objects, the Mudflap Violations view will contain a comprehensive list of these errors (data from the output log). You can double-click an error to locate its corresponding source code.
The Mudflap Violations view has the following icons:
| Icon | Name | Description |
|---|---|---|
| Open Log | If a session view is not currently open, open or import a log file from the system or remote target. | |
| Scroll Lock | Prevent the view from refreshing the data currently displayed. | |
| Refresh | Perform a manual refresh to update the data in the view. | |
| Menu | The menu options for setting preferences for the Mudflap Violations view (Preferences), opening a Mudflap log file (Opening Mudflap Log…), and locating a specific error or object. |
|
If you double-click on an item in the view, you'll obtain the source navigation for that item. If you cick a column heading, the data in the list is sorted according to the column you selected. |
The main view shows the unique errors, and if you expand a particular violation, you'll receive information about nearby objects, a backtrace, similar errors, as well as other detailed information.
For a description about the errors returned by Mudflap, see “Descriptions of Mudflap results.”
You can perform a search in the Mudflap Violations view to search the output log for specific data.
![]()
Searching feature () in the Mudflap Violations view.
The icons for the Find area are:
| Icon | Name | Description |
|---|---|---|
| Previous | Begin search (find backwards) from the current cursor location and go backward. To find the previous occurrence of the same text in the current view of the output log file, select the Previous icon again. The previous occurrence of the text is then selected in the view. Repeat to continue finding the previous occurrences of the text you specified. | |
| Next | Begin search (find forwards) from the current cursor location and go forward. To find the next occurrence of the same text in the current view of the output log file, select the Next icon again. The next occurrence of the text is then selected in the view. Repeat to continue finding the next occurrences of the text you specified. | |
| Match case | Search returns results that precisely match the capitalization specified in the search string. | |
| Whole word | Search returns results that match the whole word specified in the search string as a single unit. | |
| Wrap around | The search continues from the end of the file to the beginning of the file for the specified search text. |
The type of errors that Mudflap detects includes overflow/underflow (running off the ends of buffers and strings) and memory leaks.
For example, the following Mudflap output results are the result of an illegal deallocation of memory, which is illustrated by the following code segment:
#include <stdio.h>
#include <stdlib.h>
#include <string.h>

int main(int argc, char ** argv){
  char * str = "";
  if (argc>1) {
     str = malloc(10);
     // ...
  }
  printf("Str: %s\n",str);
  free(str);
  return 0;
}
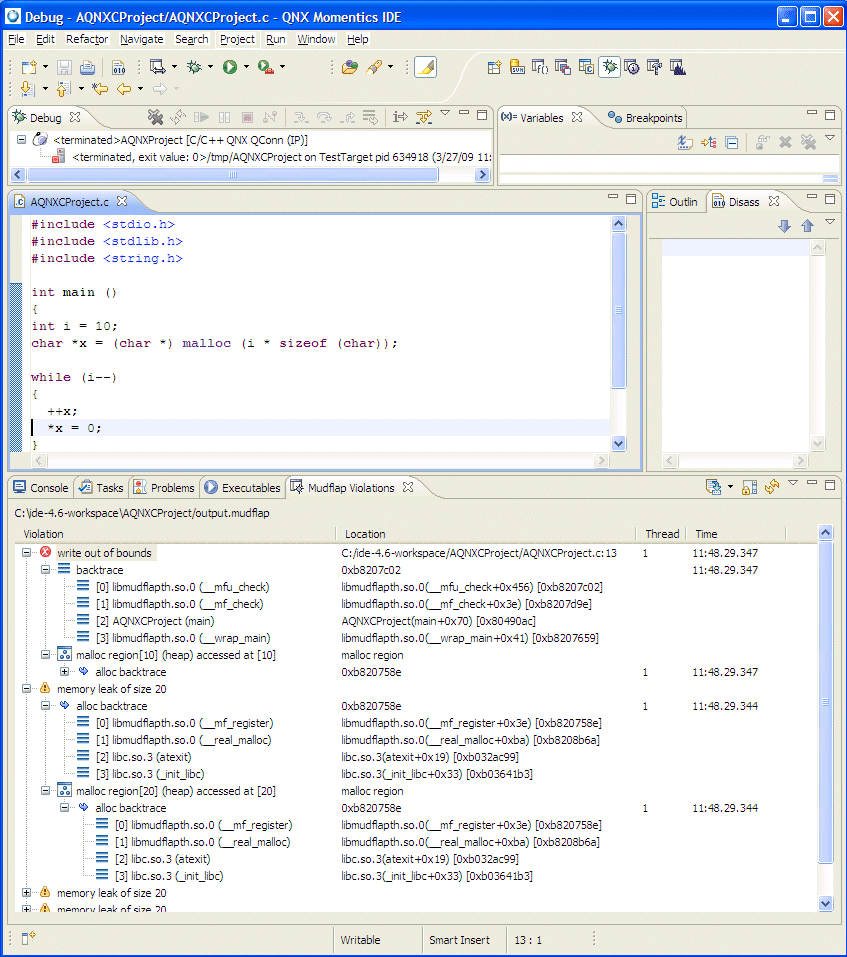
Sample Mudflap outputs results in the Mudflap Violations view.
The object name includes the name identified by Mudflap (i.e. if it's a local variable); otherwise, it can include the area, size and/or reference number (a pointer).
The output from the Console for this example looks like this:
[Console output redirected to file:C:\ide-4.6-workspace\AQNXCProject\output.mudflap]
Str:
*******
mudflap violation 1 (unregister): time=1238449399.353085 ptr=0x804a4b0 size=0
pc=0xb8207109 thread=1
      libmudflapth.so.0(__mfu_unregister+0xa8) [0xb8206d2c]
      libmudflapth.so.0(__mf_unregister+0x3c) [0xb8207104]
      libmudflapth.so.0(__real_free+0xad) [0xb82091c9]
      AQNXCProject(main+0x41) [0x804902d]
Nearby object 1: checked region begins 0B into and ends 0B into
mudflap object 0x8055500: name=`string literal'
bounds=[0x804a4b0,0x804a4b0] size=1 area=static check=0r/0w liveness=0
alloc time=1238449399.352085 pc=0xb8207593 thread=1
number of nearby objects: 1
Leaked object 1:
mudflap object 0x8055290: name=`malloc region'
bounds=[0x8055248,0x805525b] size=20 area=heap check=0r/0w liveness=0
alloc time=1238449399.350085 pc=0xb8207593 thread=1
      libmudflapth.so.0(__mf_register+0x3e) [0xb820758e]
      libmudflapth.so.0(__real_malloc+0xba) [0xb8208b6a]
      libc.so.3(atexit+0x19) [0xb032ac99]
      libc.so.3(_init_libc+0x33) [0xb03641b3]
Leaked object 2:
mudflap object 0x8055360: name=`malloc region'
bounds=[0x8055318,0x805532b] size=20 area=heap check=0r/0w liveness=0
alloc time=1238449399.351085 pc=0xb8207593 thread=1
      libmudflapth.so.0(__mf_register+0x3e) [0xb820758e]
      libmudflapth.so.0(__real_malloc+0xba) [0xb8208b6a]
      libc.so.3(atexit+0x19) [0xb032ac99]
      AQNXCProject(_start+0x42) [0x8048f2a]
Leaked object 3:
mudflap object 0x8055430: name=`malloc region'
bounds=[0x80553e8,0x80553fb] size=20 area=heap check=0r/0w liveness=0
alloc time=1238449399.351085 pc=0xb8207593 thread=1
      libmudflapth.so.0(__mf_register+0x3e) [0xb820758e]
      libmudflapth.so.0(__real_malloc+0xba) [0xb8208b6a]
      libc.so.3(atexit+0x19) [0xb032ac99]
      AQNXCProject(_start+0x61) [0x8048f49]
Leaked object 4:
mudflap object 0x80576a0: name=`malloc region'
bounds=[0x805a098,0x805a09f] size=8 area=heap check=0r/0w liveness=0
alloc time=1238449399.352085 pc=0xb8207593 thread=1
      libmudflapth.so.0(__mf_register+0x3e) [0xb820758e]
      libmudflapth.so.0(__real_malloc+0xba) [0xb8208b6a]
      libc.so.3(_Initlocks+0x4c) [0xb0357aac]
      libc.so.3(__pthread_once+0x92) [0xb0320e32]
Leaked object 5:
mudflap object 0x8057708: name=`malloc region'
bounds=[0x8063bd8,0x8063fd7] size=1024 area=heap check=0r/0w liveness=0
alloc time=1238449399.353085 pc=0xb8207593 thread=1
      libmudflapth.so.0(__mf_register+0x3e) [0xb820758e]
      libmudflapth.so.0(__real_malloc+0xba) [0xb8208b6a]
      libc.so.3(_Fbuf+0x4a) [0xb0352dea]
      libc.so.3(_Fwprep+0x73) [0xb0353433]
number of leaked objects: 5
And this information from the console for the example above can be explained as follows:
mudflap violation 1 (unregister): time=1238449399.353085 ptr=0x804a4b0 size=0
This output refers to the first violation encountered by Mudflap for the example. It was attempting to deallocate a memory object with base pointer 0x804a4b0. The timestamp can be decoded as 353 milliseconds on Monday March 30.
pc=0xb8207109 thread=1
      libmudflapth.so.0(__mfu_unregister+0xa8) [0xb8206d2c]
      libmudflapth.so.0(__mf_unregister+0x3c) [0xb8207104]
      libmudflapth.so.0(__real_free+0xad) [0xb82091c9]
      AQNXCProject(main+0x41) [0x804902d]
The pointer access occurred at the given PC value in the instrumented program, which is associated with the project AQNXCProject in the main() function. The libmudflapth.so.0 lines provide a few levels of stack backtrace information, including PC values in square brackets, and occasionally module and function names.
Nearby object 1: checked region begins 0B into and ends 0B into
There was an object near the accessed region, and in fact, the access is entirely within the region, referring to its byte #0.
mudflap object 0x8055500: name=`string literal'
bounds=[0x804a4b0,0x804a4b0] size=1 area=static check=0r/0w liveness=0
The result indicates a “string literal”, and the object has the specified bounds and size. The check part indicates that it has not been read (0r for this current access), and never written (0w). The liveness portion of the results relates to an assessment of how frequently this object has been recently accessed; in this case, no access.
If the result indicated “malloc region”, then the object would have been created by the malloc() wrapper on the heap.
alloc time=1238449399.350085 pc=0xb8207593 thread=1
      libmudflapth.so.0(__mf_register+0x3e) [0xb820758e]
      libmudflapth.so.0(__real_malloc+0xba) [0xb8208b6a]
      libc.so.3(atexit+0x19) [0xb032ac99]
      libc.so.3(_init_libc+0x33) [0xb03641b3]
The moment of allocation for this object is described by the time and stack backtrace. If this object was also deallocated, there would be a similar deallocation clause. Because a deallocation clause doesn't exist, this means that the object is still alive, or available to access.
To summarize a conclusion for the information above, some code in the main() function for the project called AQNXCProject contains an illegal deallocation of memory because an operation is being performed on a pointer that doesn't point to an appropriate heap memory segment (a heap-allocated block that has not yet been properly deallocated). This situation is detected by the -internal-checking option.
In the Mudflap Violations view, you might see errors similar to the following:
The illegal deallocation of memory can generate a memory corruption (a stack, heap, or static segment) or immediate segmentation fault runtime errors.
To address the illegal deallocation of memory, you can: add a condition to test for a NULL as a pointer and verify that it can be freed; ensure that the same pointer can never point to different types of memory so that you don't free stack and static memory; never reassign an allocated pointer (except for a NULL or other allocation); nullify the pointer immediately after deallocation, unless it is a local variable which is out of scope.
|
If you need to iterate over allocated memory, use another pointer (alias), or just use an index. |
The following code shows an example of a buffer overflow:
int main(int argc, char ** argv){
  char * str = "";
  if (argc>1) {
     str = malloc(10);
     // ...
  }
  printf("Str: %s\n",str);
  free(str);
  return 0;
}
For example, the following code shows an example of a buffer overflow trapped by a library function:
#include <stdio.h>
#include <stdlib.h>
#include <string.h>

int main(int argc, char ** argv){
  char * ptr = NULL;
  ptr = malloc(12);
  strcpy(ptr,"This is a Mudflap example!");
  return 0;
}
For example, the following code shows an example of an uninitialized memory read.
#include <stdio.h>
#include <stdlib.h>
#include <string.h>

int main(int argc, char ** argv){
  char * ptr = NULL;
  ptr = malloc(13);
  free(ptr);
  strcpy(ptr,"This is a Mudflap example!");
  return 0;
}
For example, the following code shows an example of a memory leak:
#include <stdio.h>
#include <stdlib.h>
#include <string.h>

int main(int argc, char ** argv){
  char * str = malloc(10);
  if (argc>1) {
     str = malloc(20);
     // ...
  }
  printf("Str: %s\n",str);
  free(str);
  return 0;
}
For example, the following code shows an example of an uninitialized memory read:
#include <stdio.h>
#include <stdlib.h>
#include <string.h>

int main(int argc, char ** argv){
  char * ptr = NULL;
  ptr = malloc(13);
  if (argc>1)
     strcpy(ptr,"Hello World!");
  ptr[12]=0;
  printf("%s\n",ptr);
  return 0;
}
|
|
|
|

